Rapp. Comm. int. Mer Médit., 37,2004
23
COMPLEX TRACE ANALYSIS APPLICATIONS TO THE SOROKHIN TROUGH SEISMIC DATA,
THE NORTHERN BLACK SEA
Derman Dondurur
1
, Mustafa Ergün
2*
and Günay Çifçi
3
1
Dokuz Eylül University, Department of Geophysics, Buca-Izmir, Turkey
2
Yasar University, Alsancak, Izmir, Turkey - *mustafa.ergun@yasar.edu.tr
3
Dokuz Eylül University, Institute of Marine Sciences and Technology, Izmir, Turkey
Abstract
Complex trace attribute analysis was used to determine the acoustic anomalies from gas accumulations on the high resolution seismic data
from Sorokhin Trough in the Northern Black Sea. In bright spot zones, envelope of the single channel seismic data shows strong acoustic
anomalies. Phase and polarity reversals are observed on instantaneous phase and polarity sections, and the gas saturated zones are observed
to have much lower frequencies on the instantaneous frequency sections.
Key Words: Single Channel Seismic, Integrated Instantaneous Attributes, Gas Accumulation.
Introduction
The Sorokhin Trough, the western submarine termination of the
Great Caucasus is situated within the eastern Black Sea basin on the
continental slope and rise. The basin is mainly filled by the Maikopian
(Oligocene-Lower Miocene) deposits that make up numerous clay
diapirs and ?uid related features at the sea?oor.
Detailed seismic investigations were carried out across faults,
hydrocarbon ?uid escapes, and fields of gas hydrates in the Sorokhin
Trough during the UNESCO-TTR 6 (Training Through Research)
cruise in 1996. High resolution seismic re?ection profiling was
carried out along five lines (PS256 to PS260) at water depths of 600
2100 m to define the faults, diapirs, mud volcanoes, hydrocarbon
?uids and bright spots. The diapirs seem to have been produced by a
lateral tectonic compression from the south (1).
A single channel seismic system was used during the survey with a
recording length of 3 s. An airgun of 120 atm was used with a shot
interval of 10 s (about 40 m). The receiving length of streamer was 75
meters with 6 active units.
Complex Trace Analysis
Complex trace attribute analysis is based on the computation of
time-dependent envelope, phase and frequency variations of the
seismic trace (2), which allows a better definition of the re?ections
from water-gas/oil or gas-oil interfaces. The applications of the
complex trace analysis are generally restricted to the areas where
large-scale bright spots occur (3, 4, 5). In these zones, the envelope of
the seismic data shows strong acoustic anomalies because of the high
velocity contrast between gas accumulated zone and the overlying
sediments. Since the velocity of the gas saturated zone is lower than
the sedimentary layers, polarity reversals are observed on the
instantaneous phase and polarity sections, and the gas saturated zones
are observed to have much lower frequencies on the instantaneous
frequency sections because of the absorption of the seismic energy.
In complex trace analysis, the recorded seismic trace S(t) is
supposed to be the real component of the complex (or analytical)
signal and the imaginary component Q(t) is computed using Hilbert
transform of S(t). Then the envelope R(t), instantaneous phase
?
(t)
and frequency
?
(t) of the trace are given by (6, 2),
(1)
(2)
(3)
Applications to the Sorokhin Through Data
The Sorokhin Through area shows many diapirs, most of which is
crowned by mud volcanoes. The complex trace attribute analysis was
applied whole seismic data to determine the acoustic anomalies (gas
accumulations or bright spots). Bright spots are especially observed
above the tops and slopes of the diapiric structures. This is especially
evident on line PS256 in which a number of diapiric folds are
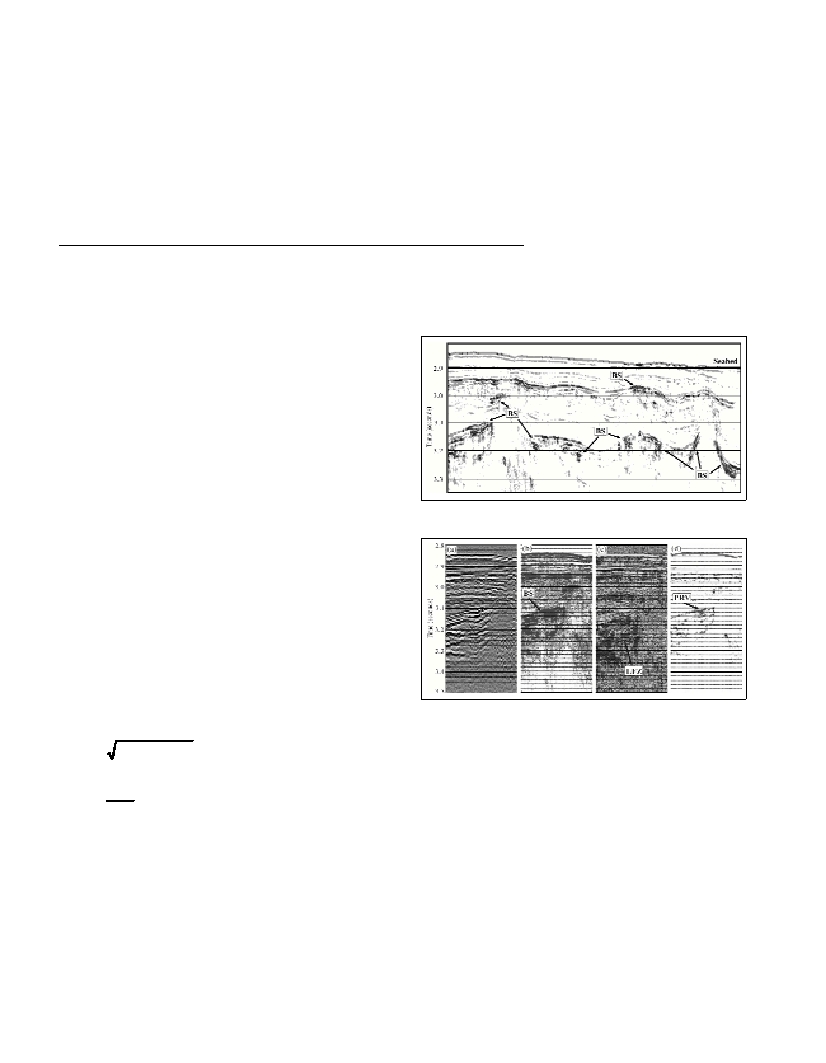
observed. Fig. 1 shows the envelope section of the PS256 showing
several diapiric structures and very high-amplitude re?ections (bright
spots) near the diapirs. Fig. 2 shows a small part of envelope, instan-
taneous frequency and polarity sections from slope of a diapiric uplift
from PS256. Envelope section shows very strong re?ection event
between 3.1-3.2 s. Polarity section shows that this re?ection has
negative polarity and frequency section indicates very low frequency
zone below this strongly re?ective interface. These indications clearly
state a localized gas accumulation located at the side of the diapir. On
the other hand, some gas uplifting structures as low frequency trans-
parent columns with strong re?ections at both sides are also observed
in PS258, whereas some localized and horizontal gas accumulation
anomalies are observed on envelope section of line PS257.
Fig. 1. Envelope of line PS256 showing several diapiric structures and a
number of bright spot anomalies (BS) near the diapirs.
Fig. 2. Complex trace application to a part of line PS256. (a) Original
data, (b) envelope, (c) instantaneous frequency and (d) instantaneous
polarity sections. The bright spot anomaly (BS) in (b), the low frequency
zone (LFZ) in (c) and the polarity reversal (PRV) in (d) indicate a
localised gas accumulation.
The application of the complex trace analysis showed the presence
of shallow accumulations of hydrocarbon gases. These negative
polarity, high amplitude, and relatively short re?ections are distributed
250-800 ms interval below the sea ?oor.
References
1-Limonov A.F., Ivanov M.K., Kozlova E.V., VanWeering T.C.E.,
Meisner L.B., Woodside J.M., 1998. The structure of the sedimentary
cover and active ?uid venting in the Sorokhin Trough (Northern Black
Sea), Rapp. Comm. int. Mer Médit., 35:80-81.
2-Taner M.T., Koehler F., Sheriff R.E., 1979. Complex seismic trace
analysis. Geophysics, 44: 1041-1063.
3-Morozov I.B., Smithson S.B., 1996. Instantaneous polarization
attributes and directional filtering. Geophysics, 61: 872-881.
4-Yilmaz Ö., 1987. Seismic Data Processing. Society of Exploration
Geophysicists, Tulsa.
5-Ampilov I.P., and Arts R.J., 2000. Seismic multi-attribute analysis
techniques for reservoir characterization. 62
nd
EAGE Meeting.
6-Farnbach J.S., 1975. The complex envelope in seismic signal analysis.
Bull. Seism. Soc. Am., 65: 951-962.
t
)
t
(
)
t
(
?
?
?
=
?
[
]
)
t
(
S
/
)
t
(
Q
tan
)
t
(
1
-
=
?
[][]
2
2
)
t
(
Q
)
t
(
S
)
t
(
R
+
=