OBSERVATIONS OF PHYSICAL AND BIOLOGICAL ROUGHNESS ON THE EBRO DELTA INNER SHELF
Soriano S.
*
, Guillén J. and Demestre M.
Institut de Cičncies del Mar (CSIC), Barcelona. Spain - * ssoriano@cmima.csic.es
Abstract
Time series of video observations of the sea bottom in the Ebro Delta inner shelf were analyzed in order to estimate the bottom roughness
associated with both physical and biological morphological components. Video images display, for the most of the time, the ripples
development on the bottom as active or relict bedforms.. Biological roughness is mainly caused by ophiuroids and shells tanatocenosis that
change their abundance through the study period. Bottom physical roughness associated to ripples ranges between 0 and 3.2 cm whereas
the total biological roughness ranges between 0.27 and 0.81 cm.
Keywords: Ripples, Benthic communities, Bottom Roughness, Ebro Delta
Rapp. Comm. int. Mer Médit., 37,2004
69
Introduction
Bottom roughness could be understood as a measure of the
morphological variability with respect to a ?at bottom. The bottom
roughness is a crucial parameter because it determines the shear stress
of waves and currents on the bottom and, consequently, the rate of
sediment transport in the bottom boundary layer.
It has been identified three kinds of roughness (1,2): grain
roughness, moveable bed roughness and form drag roughness. In
sandy bottoms and under high energetic conditions moveable bed
roughness would be the most important type of roughness, while form
drag roughness would be for intermediate-low ones. On the other
hand, silty bottoms roughness is usually dominated by bioturbation
and, as a consequence of that, form drag roughness would be the main
type of roughness (2).
In this paper changes in the physical and biological bottom
roughness in a sandy bottom of the Ebro Delta inner shelf are studied.
Materials and Methods
One benthic tripod was deployed and an oceanographic cruise was
carried out in November 2001 in the Ebro Delta (NW Mediterranean)
during 9 days. Bottom sediment grain size and time-series of waves,
currents and time-lapse video images were monitored at 9 m depth.
Using time-lapse video images morphological features and biological
components on the bottom were analyzed in order to obtain bottom
physical roughness values (K
b
). The Grant and Madsen (1) expression
was used for the estimation of the physical roughness: K
b
= 27.7
?
r2
/
?
r
, being
?
r
the observed ripple wavelength and
?
r
the ripple
height (which has been measured by divers and considered constant
(1cm). On the other hand, the biological roughness (K
bio
) was
estimated from measurements of density and sizes of main biological
components using a modified Grant and Madsen expression (2),
?
bio
(the biological obstacles height) was assumed constant (
?
bio
= 0.3 cm)
and
?
bio
(distance between biological obstacles) was calculated as the
square root of the inverse obstacles density.
Results
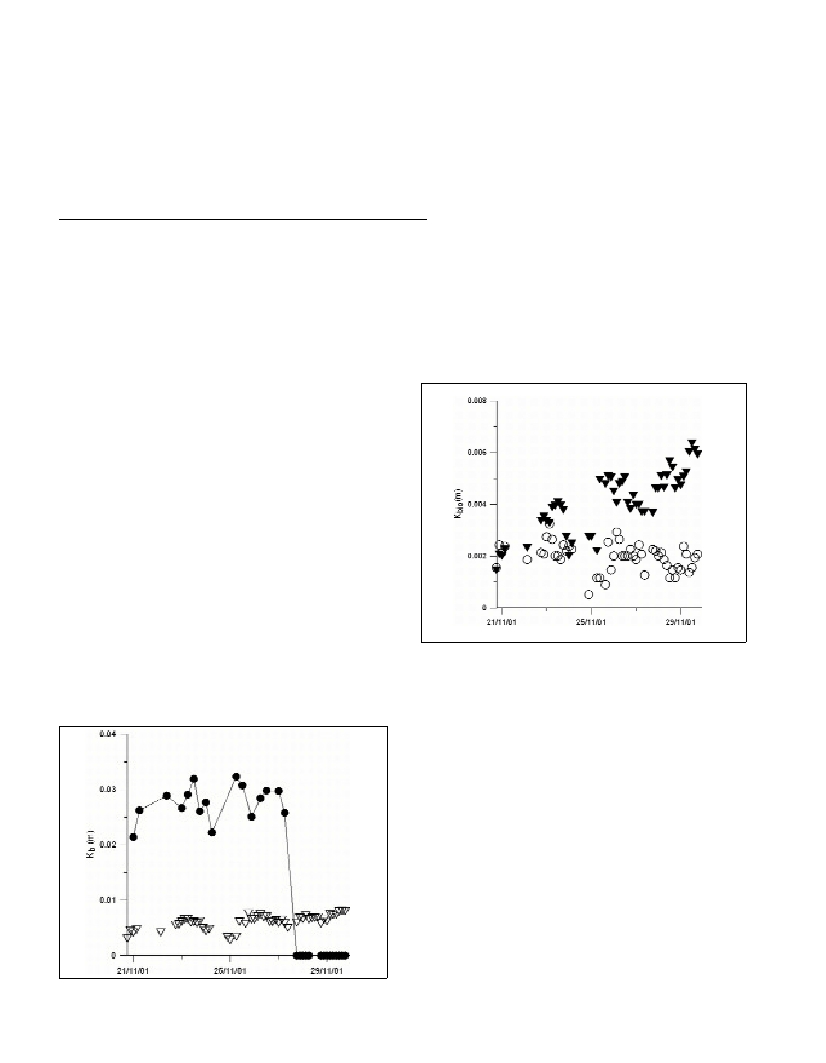
Observed ripple wavelength varies between 8.6 and 12.9 cm. As a
result of this, observed physical bottom roughness takes values
between 2.14 and 3.23 cm. When the bottom was completely ?at it
was assigned to K
b
the value of median grain size (D
50
) (Fig. 1).
Ophiuroids and pieces of shells are the most important biological
components that affect bottom roughness during the study period.
Ophiuroids density has reached values near 170 individuals per square
meter, causing a K
bio
that oscillates between 0.05 and 0.32 cm. Pieces
of shells are very abundant (maximum values near 650 pieces per
square meter) and contribute to bottom biological roughness in ranges
between 0.15 and 0.64 cm. Figure 2 shows tendencies in both kinds of
biological roughness. Ophiuroids do not present a marked tendency
through the study period while pieces of shells increase its values in
time. Total K
bio
(sum of K
bio
obtained by ophiuroids and shells)
displays values from 0.27 to 0.81 cm.
Fig. 2. K
bio
for ophiuroids (
?
) and shells pieces ()during the study
period.
Discussion and conclusions
The present work shows the relative contribution of biological
components and sedimentary structures tothe bottom roughness.
Ripple morphology remains relatively constant during the study
period, although they are ?attened by ophiuroids bioturbation.
Ophiuroids density is rather steady during the study period whereas
pieces of shells increase its abundance (and its contribution to the
bottom roughness) as a consequence of being inert biogenic material
appearing after storm periods in the bottom surface.
The biological roughness represents a subordinate but not
negligible amount (about 20%) of the form drag roughness.
Therefore, physical and biological roughnesses coexist and both
should be taken into account for sediment transport studies.
References
1-Grant, W.D., and Madsen, O.S., 1982. Movable bed roughness in
unsteady oscillatory ?ow. Journal of Geophysical Research, 87: 469-481.
2-Harris, C.K., and Wiberg, P.L., 2001. A two-dimensional, time-
dependent model of suspended sediment transport and bed reworking for
continental shelves. Computers and Geosciences, 27: 675-690.
Fig. 1. Observed physical () and biological () bottom roughness
during the study period.