Rapp. Comm. int. Mer Médit., 37,2004
114
THE ADRIATIC SEA SURFACE TEMPERATURE VARIABILITY
VIA EOF/WAVELET ANALYSIS OF THE AVHRR DATA
Milivoj Kuzmic
1*
and Zoran Pasaric
2
1
Center for Marine and Environmental Research, Rudjer Boskovic Institute, P.O. Box 180, 10002 Zagreb, Croatia
* kuzmic@rudjer.irb.hr
2
Geophysical Department, Faculty of Science, Horvatovac bb, 10000 Zagreb, Croatia
Abstract
Fourteen years of five-day averaged medium-resolution (9.3km) Adriatic remotely sensed SST fields is analysed with a view to better
discern their spatial and temporal variability. The EOF analysis is employed to derive orthogonal spatial patterns, and continuous wavelet
transform (CWT) applied to EOF-derived principal component time series. The first EOF mode revealed dominant spatial patterns,
carrying prominent part of the total variance in both time- and space-demeaned cases (98.5% and 66% respectively). The time series of
band-integrated principal components has provided revealing insights into intra- and inter-annual variability.
Keywords: Adriatic Sea, surface temperature, wavelet analysis
Introduction
The sea surface temperature dominates the exchange of heat with
atmosphere, and exerts in?uence on the transfer of momentum and
moisture affecting a wide range of sea motions. Discerning its spatial
and temporal variability using in situ data alone is rarely easy, so
spaceborne sensors are welcome to provide much needed repeatability
and coverage. LeVourch et al.[1], for example, used AVHRR imagery
to compile an atlas of the Mediterranean Sea fronts. More recently,
Gacic et al.[2] used low resolution (18km) weekly averaged time
series of AVHRR scenes to study seasonal and inter-annual variability
of the Adriatic Sea surface temperature. Their analysis showed an
absence of permanent surface thermal features, and revealed basin-
scale four-seasonal variability. We report deliberations of an ongoing
study better resolving both spatial and temporal variability in a longer
(14 years) Adriatic AVHRR SST dataset. Improvement in resolving
temporal change is sought by employing the wavelet analysis offering
localisation in both time and frequency domains. The analysis is
performed on EOF-derived time series of principal components of the
surface temperature fields.
Data
The remotely sensed SST data set used in this study is an Adriatic
subset of the NASA Seasonal to Interannual Prediction Project
AVHRR global pentad SST set (kindly provided by Dr. Kenneth
Casey). It was created by extracting the area spanning 12
o
to 20
o
East
longitude, and 40
o
to 46
o
North latitude. The extracted subset
comprised 1022 SST fields (14 years [1985-1998] x 73 pentads /year)
each consisting of 1556 pixels. Not a single time-series had less than
70 gaps and only 28 series had more than 400 gaps. In order to fill in
the gaps simple linear interpolation was performed on residuals after
which the removed annual and semi-annual cycles were added back.
To validate the subset we looked at 2 northern Adriatic in situ SST
series spanning the same period.
Two-variant EOF analysis was applied, one with temporal and the
other with spatial mean removed prior to further calculations. The
EOF analysis allowed identification of orthogonal spatial patterns. It
is tempting although not necessary to interpret the patterns as natural
modes of variability of the studied fields. Projected onto those
functions, the Adriatic SST fields yielded time series amenable to
spectral analysis. For the wavelet analysis we have chosen the Morlet
wavelet, well suited to capture the frequency content of a time series.
It provides both the modulus measuring the energy density, and the
real part commensurate with the intensity and phase of the signal
varying in the time-frequency domain.
Results
Removal of the temporal and spatial mean from the original set has
allowed pattern ranking by respective residual variance. In both cases
the first EOF mode provided dimensionless and timeless dominant
spatial patterns carrying respectively 98.5% and 66% of the total
residual variance. Related time series of principal components
provided temporal variability with two contributions standing out
clearly: the annual and semi-annual harmonic, not surprising
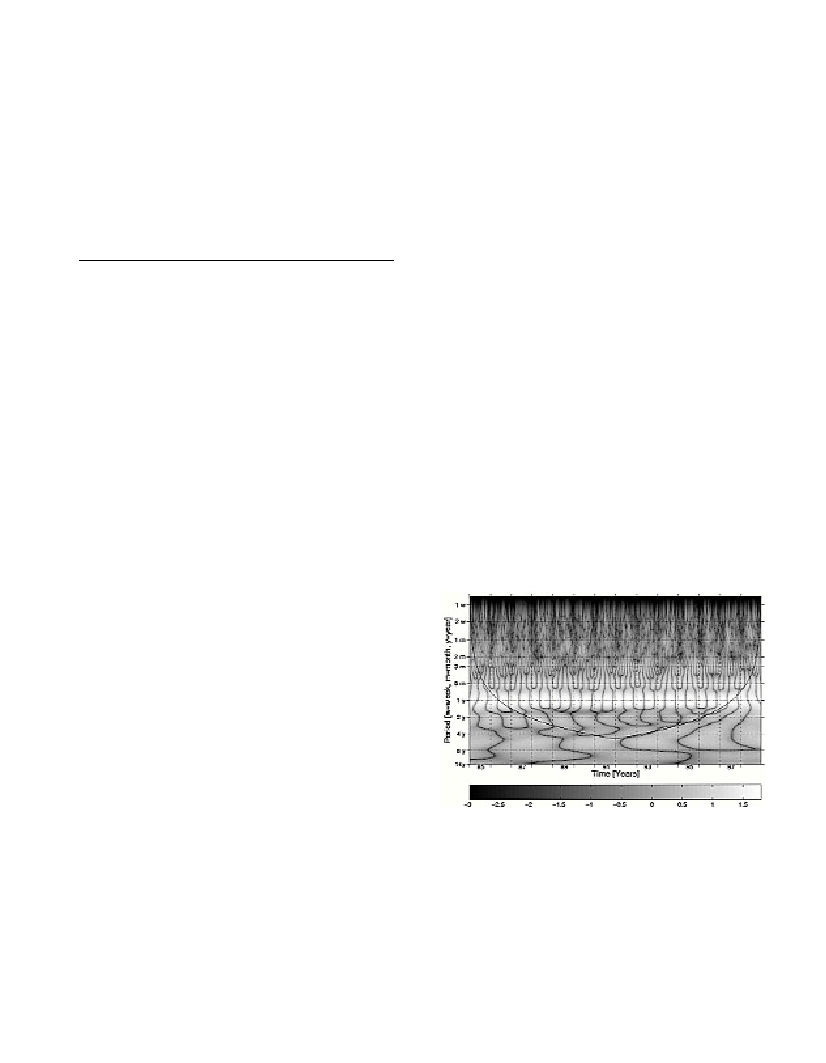
considering the in?uence of the annual solar cycle. An example CWT
spectrum is presented in Figure 1, for the time-demeaned signal. The
absolute value of the real part of the CWT spectrum is plotted. Also
plotted is the cone of in?uence, which maps out the extent of the edge
effects. The palette scale is logarithmic. The annual signal dominates
the spectrum, but the figure also presents plenitude of other
periodicities whose intensity changes with time. For example,
removal of the annual and semi-annual harmonics prior to the CWT
allows bi-annual component to surface, but also the irregularities near
the six-month scale to present themselves. The CWT analysis
performed on the space-demeaned series has also yielded spectrum
with prominent annual signal.
Other revealing pieces of information can by gained by looking at
the time series of band-integrated principal components. In both time-
demeaned and space-demeaned cases intra-annual anomalies have
been observed in 0-1.5 month band, with pronounced inter-annual
variability in some years, e.g. 1989 vs. 1993 in case of time-demeaned
series, or the year 1995 vs. 1996, in case of the space demeaned data.
The intensity of the integrated signals in this shortest-period band
generally re?ected relation observed in the original residual series:
about five times stronger signal remained after time demeaning than
after prior removal of the spatial mean. Consistent amplitude
difference was also observed in other bands, the 4 – 18 months in
particular. Here the size of the time-demeaned amplitude was about an
order of magnitude larger than the one for the space demeaned signal.
The time-demeaned signal in this band exhibited more regular
oscillation throughout the observed period, whereas the space-
demeaned counterpart has shown more provocative irregularities in
the second half of the observed period.
Fig. 1. CWT spectrum of the time demeaned series of principal compo-
nents.
References
1-LeVourch J., Millot C., Castagne N., LeBorgne P., and Olry J.P., 1992.
Atlas of thermal fronts of the Mediterranean Sea derived from satellite
imagery. Mem. Instit. Oceanogr. Monaco, No 16, 146 p.
2-Gacic M., Marullo S., Santoleri R., and Bergamasco A., 1997. Analysis
of the seasonal and interannual variability of the sea surface temperature
field in the Adriatic Sea from AVHRR data (1984-1992). J. Geophys. Res.,
102C: 22937-22946.