Rapp. Comm. int. Mer Médit., 37,2004
131
ALIASING DUE TO SAMPLING OF THE ADRIATIC DENSITY ANOMALY IN SPACE
Zoran Pasaric
(1)
*, Mirko Orlic
(1)
, Craig M. Lee
(2)
1
Andrija Mohorovicic Geophysical Institute, Faculty of Science, University of Zagreb, Horvatovac bb, 10000 Zagreb,
Croatia - *pasaric@rudjer.irb.hr, orlic@rudjer.irb.hr
2
Applied Physics Laboratory, University of Washington, 1013 NE 40th St. Seattle,
WA 98105-6698, USA - craig@apl.washington.edu
Abstract
Errors associated with coarse sampling of the sub-surface density anomaly over the middle and north Adriatic are analyzed, using
underway data collected within the DOLCEVITA project. The errors are seasonally and spatially dependent. They are larger in spring then
in winter and also over the shallow Italian part as compared to the deeper Croatian part of the basin. The results should be relevant for the
planning of future CTD measurements in the region.
Keywords: spatial aliasing, density anomaly, Adriatic Sea
Introduction
The present work is based on the sub-surface temperature and
conductivity data measured with high spatial resolution during two
cruises (31 Jan – 24 Feb and 26 May – 15 Jun 2003) conducted by the
R/V Knorrover the middle and north Adriatic within the
DOLCEVITA project. High spatial resolution enabled a posteriori
analysis of sampling errors that would occur if the same
measurements were performed with coarser spatial sampling.
Data and Analysis Procedure
Underway sea surface temperature and conductivity were measured
using a Falmouth Scientific thermosalinograph (OCM-TH-212)
which is part of the R/V Knorrmeteorological (IMET) sensor system.
The sensors were mounted on the bow at 5 m depth. Readings were
averaged and recorded at one-minute time intervals along the whole
ship path (7000 km for the winter and 6700 km for the spring cruise)
together with time and location. The typical cruising speed of 8 knots
gives the distance between data samples of ca. 250 m.
After basic quality check, the density anomaly was calculated and
subsequently analysed. First, the data measured while sailing speed
was below 4 knots were discarded and linear interpolation was
performed every 100 m along the ship track. Next, sub-sampling was
performed with various spatial steps (
?
x= 1, 2, 5, 10 km), the sub-
sampled series were linearly interpolated back to 100 m intervals, and
the squared differences were calculated between this and the original
series. The starting point for sub-sampling was systematically varied
within the first
?
xkilometers of the sequence (with step of 100 m),
and squared differences obtained were averaged. Finally, we covered
Adriatic with rectangles (bins) of 2 by 2 km, averaged all the
differences that fall within particular rectangle, and took square root.
The root mean square (RMS) sub-sampling density anomaly error
thus obtained was plotted as a 3D bar graph.
Discussion and conclusions
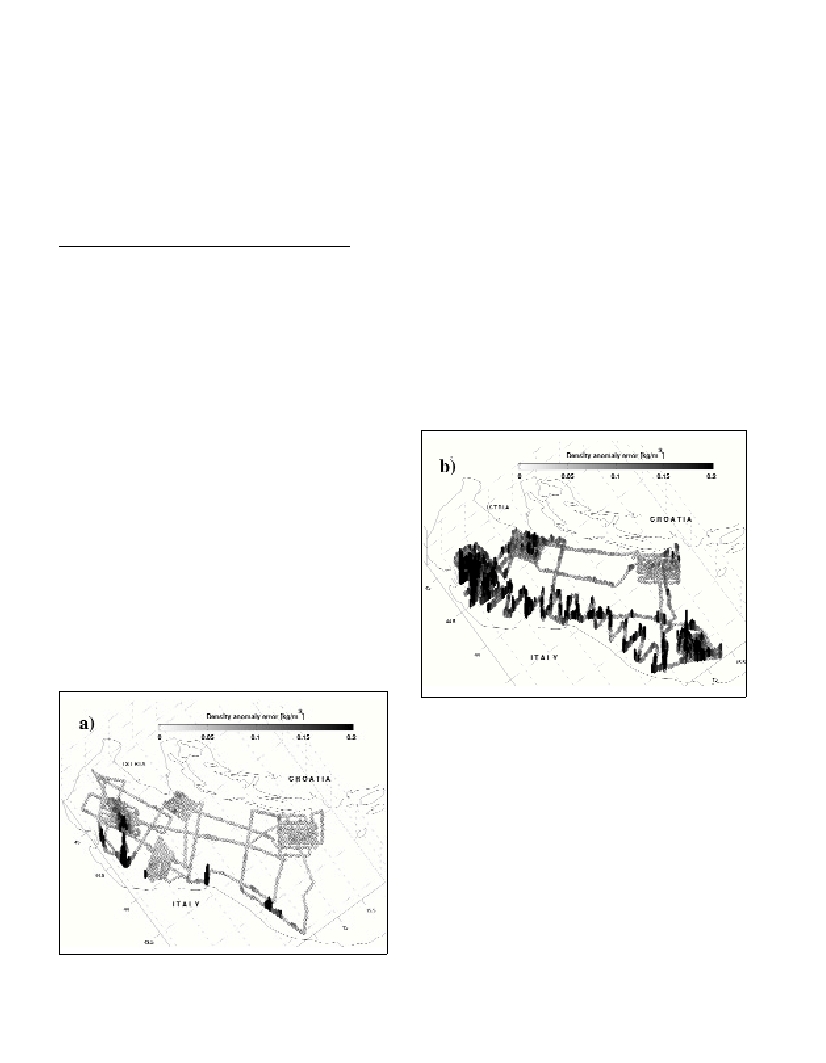
We discuss brie?y results for 5 km sampling interval. Large sub-
sampling errors are associated with the presence of small scale
features in the density field. For winter situation (Fig. 1) the error is
generally small. The ‘island’of large errors in the middle part of
northern Adriatic is associated with the light, Po River water that has
been advected by bora (see e.g. [3]) which blew during the greater part
of the February cruise. Other occurrences of large errors are also
associated with the Po River out?ow, aligned with the Italian coast. In
spring (Fig. 2) large errors cover the wide area along the Italian coast,
whereas maximum is reached in the front of the Po River mouth. In
the middle part of the basin, as well as close to the Croatian coast,
errors are generally small, except close to the cap of Istria peninsula
(probably in?uence of bora) and at the very south-east corner
(probably in?uence of Dalmatian rivers). For 1 km sampling interval
the error is typically below 0.01 kg/m
3
in winter and 0.04 kg/m
3
in
spring. However, it may still be very large over some small regions
(not shown).
Fig. 2. Sub-sampling RMS error of density anomaly along the ship path
for the winter for the spring cruise. The error is proportional to the height
of each bar and is also indicated by the gray level. Black bar implies
error that is larger than 0.2 kg/m
3
.
It may be concluded that spatial variability of sub-surface density
field over the middle and north Adriatic is much greater in spring (i.e.
warm part of the year) than in winter (cold part of the year). Also it is
bigger over the shallow, Italian part (in?uenced by the Po River) than
over the deeper, Croatian part of the basin. The spatial aliasing error
associated with this variability is quantified which, we feel, may be
helpful for planning the future CTD measurements in the region.
References
1- Orlic M., Kuzmic M., Pasaric Z., 1994. Response of the Adriatic Sea
to the bora and sirocco forcing. Continental Shelf Research, Vol. 14, No 1:
91-116.
Fig. 1. Sub-sampling RMS error of density anomaly along the ship path
for the winter. The error is proportional to the height of each bar and is
also indicated by the gray level. Black bar implies error that is larger
than 0.2 kg/m
3
.