Rapp. Comm. int. Mer Médit., 37,2004
152
SYNTHETICALLY GENERATED ERRORS IN TIDAL CONSTITUENTS
Ivica Vilibic
Hydrographic Institute of the Republic of Croatia, Zrinsko Frankopanska 161, 21000 Split, Croatia - ivica.vilibic@hhi.hr
Abstract
The paper comprises the calculations of amplitudes and phases of tidal harmonic constituents, performed on hourly sea level data recorded
at Split tide gauge in the period 1957-2001. Interannual changes have been detected, stronger in phases than in amplitudes. The differences
are presumably generated by clock error, uncertainties in time positioning of the charts and the errors within the digitalisation process.
Therefore, two groups of artificial sea level series have been generated, in order to simulate time drift and shift in the series and to verify
their impact on the constituents.
Keywords: tide gauge, chart record, harmonic analysis.
Introduction
The computations of tidal amplitudes and phases can incorporate
artificial errors if extracted from analogous chart records [1], which
were commonly operated in the Adriatic Sea in the last half a century.
The first calculation of Adriatic harmonic constituents was based on
Bakar data measured in 1950, extracting 7 significant constituents
with amplitude higher than 1 cm. Polli [2] performed a comprehensive
tidal analysis (29 stations) and plotted amplitudes and phases for the
whole Adriatic, but using rather old data collected at the beginning of
20th century.
Data and methods
The analysis of sea level data collected in 1957-2001 period at Split
chart-recording tide gauge will be performed in this work, in order to
check quality of the data and practicability of previously estimated
harmonic constants in tidal forecasting. The digitalisation of the
charts has been performed using two different software packages: (1)
the charts from 1978 to 2001 were digitalised on an older VAX
system, thus the data is more prone to digitalisation errors (T3 period),
and (2) the charts older than 1978 were digitalised recently using PC
based package, and therefore it is expected to result in more accurate
data than the older one (T1 period – low quality charts, T2 period –
high quality charts). Harmonic analysis was performed using TASK
package (Tidal Analysis Software Kit) developed at Proudman
Oceanographic Laboratory. Furthermore, simulations of time drifts
and shifts in the series was carried out in order to evaluate the
in?uence of errors that may occur during digitalisation process, both
on the amplitudes and phases of major tidal constituents.
Results
Fig. 1 shows interannual variability of diurnal tides calculated at
Split for period 1957-2001. The difference between the constants
seems to be rather significant. For example, amplitudes are the lowest
in the T1 period (except of N
2
tide), oppositely to phases which are
commonly the largest in the T1 period (except of K
2
). Additionally,
T1 period is characterized by the highest standard deviations. The
amplitudes in T3 period are even a bit higher, whereas the phases are
lower compared to T2 period.
Fig. 1. Annual amplitudes and phases of diurnal constituents at Split.
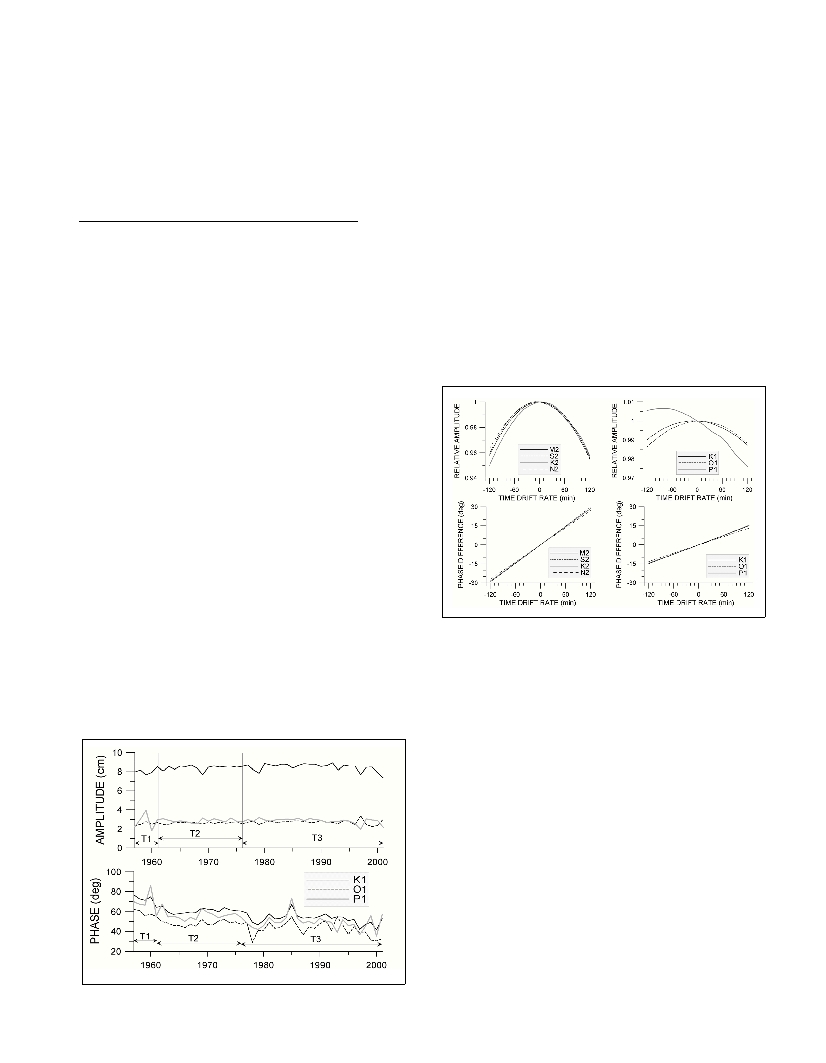
Simulated changes in constituent amplitudes and phases due to the
simulated artificial drift in time series are shown in Fig. 2. One can see
that the changes in amplitude are not as pronounced as the changes in
phase, both for semidiurnal and diurnal constituents. Nevertheless, if
the drift is large enough, semidiurnal amplitudes decrease rather
rapidly, while the phases change linearly as a function of the drift rate.
The exception is P
1
tide, which increases in amplitude when the drift
rate is negative. Such behaviour is a result of artificial energy transfer
from K
1
to P
1
tide, as K
1
tide has a period rather close to the P
1
(23.93
h of K
1
versus24.07 h of P
1
).
Fig. 2. Simulated changes in relative amplitudes and phase differences
versus time drift rate. The respective amplitude and phase are supposed
to be 1 and 0 when no time drift was simulated.
Generally, time variations of the tidal constituents have been
presumed to come from systematic errors that occurred during sea
level measurements, and during the digitalisation process of the
charts. The changes seem to be dependent on the digitalisation
technique, clock errors as well as on the uncertainties in the time
positioning of the charts. The phases of the harmonic constituents are
more vulnerable to all of the errors, while the amplitude suffers only
when large time drift and shift are presented in the series. In
particular, semidiurnal tides with low amplitudes such as K
2
and N
2
can be significantly changed, whereas diurnal tides are relatively
stable in amplitude.
Acknowledgement.A part of sea level charts has been digitised
within ESEAS-RI project (EU funded project EVR1-CT-2002-
40025). Permanent Service for Mean Sea Level kindly provided
TASK software package.
References
1 - UNESCO, 1985. Manual on sea level measurement and interpretation.
Volume I – Basic procedures. IOC Manuals and Guides 14, 83 p.
2 - Polli S., 1960. Le propagazione delle maree nell’Adriatico (in Italian),
Atti del IX Convegno dell’Associazione Geofisica Italiana, Roma, 1-11.