AFRICAN DUST DEPOSITION AND OCEAN COLOUR IN THE EASTERN MEDITERRANEAN
François Dulac*, Cyril Moulin, Hélčne Planquette, Michael Schulz, Michael Tartar
Laboratoire des Sciences du Climat et de l’Environnement - CEA-Saclay 709, F-91191 Gif-Sur-Yvette Cedex, France - *fdulac@cea.fr
Abstract
We study the impact of Saharan dust deposition on chlorophyll concentrations in the Mediterranean using ocean colour products and
simulated dust deposition ?uxes. Chlorophyll increases follow most dust deposition events but dust fertilization and wind-related effects
cannot be disentangled.
Keywords: Surface water fertilization, Dust deposition, Chlorophyll, SeaWiFS, LMDz-INCA.
Rapp. Comm. int. Mer Médit., 37,2004
190
Introduction
African dust deposition significantly contributes to soluble
phosphorus inputs to Mediterranean surface waters (1), where it is the
limiting nutrient, and probably sustains the marine productivity(2
)
.
This work aims at investigating this possible fertilization of low
productive Mediterranean waters.
Data and method
SeaWiFS daily level-3 maps (~9x9km
2
) of chlorophyll
concentration ([Chl]) were obtained from NASA(3) for 1998 2000.
Only part of the basin is observed every day because of clouds and
orbital characteristics.
The atmospheric dust cycle was simulated at a resolution of
1.84°x2.25°with LMDz-INCA, a 3-D AGCM coupled with
chemistry and aerosols (4). We extracted daily integrated dry and wet
dust deposition ?uxes (F=F
d
+F
w
).
We averaged [Chl] within the model grid (~600 pixels/cell) and
selected four grid cells across eastern Mediterranean: Southern
Central (SC: 18°E, 33.06°N), Eastern Central (EC: 22.5°E, 34.90°N),
South-western Levantine (SL: 24.75°E, 33.06°N), and Northern
Levantine (NL: 29.25°E, 34.90°N). We rejected days with
=
25% of
pixels per grid cell. This left 50-60% of days and we filled gaps using
a 7-day moving average.
Results and discussion
Maximum (resp. minimum) surface [Chl] at a given site varies
between 0.20 and 0.34 (0.04 and 0.06) mgm
3
. The seasonal cycle
shows a winter maximum of 0.20±0.05 mgm
3
in January-February,
with another, occasionally absolute, maximum in March (Fig. 1).
[Chl] drops down in spring and remains low (0.05-0.10 mgm
3
) from
May to September. From October, [Chl] slowly increases to its winter
maximum.
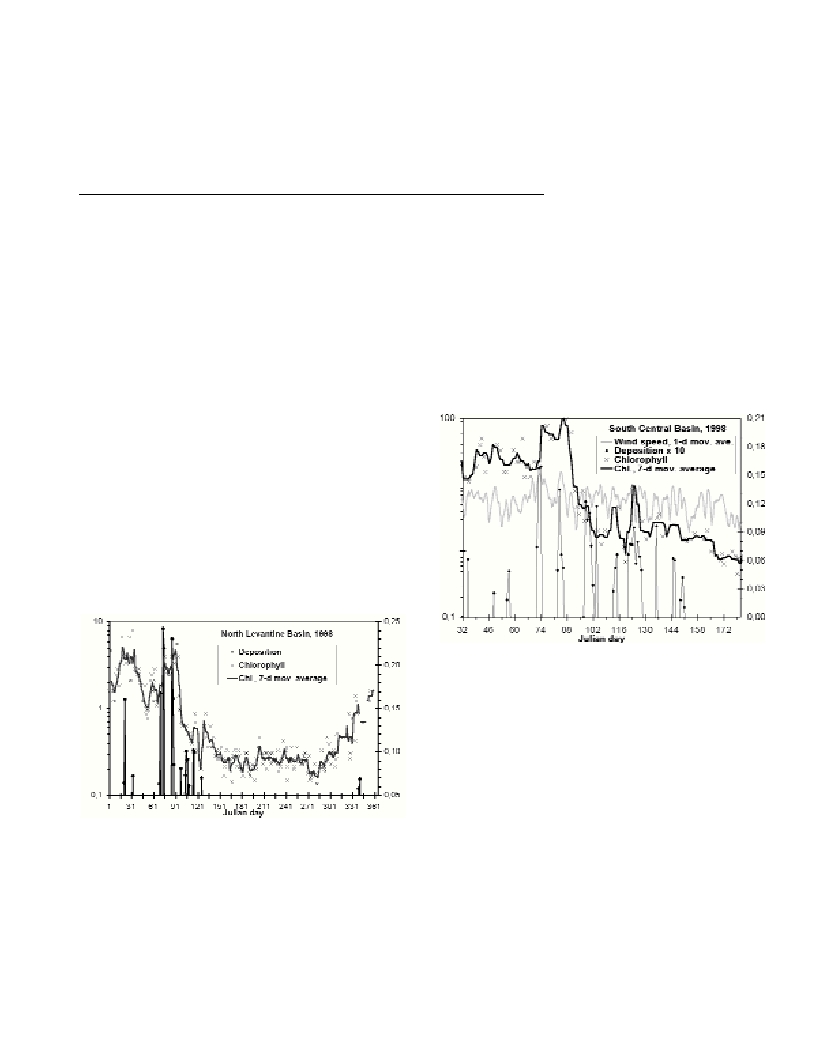
Fig. 1. Daily dust deposition, daily and 7d averaged chlorophyll at NL in
1998.
A dust outbreak generally causes high deposition at most sites.
Overall range in F is 8.938.7 gm
2
yr
1
, with a factor 2-3 of
interannual variability at a given site, and no clear trend from one year
or one site to the other. The fallout is controlled by a few wet
deposition events (F
w
/F>93%). Maximum F
w
of 15.7 gm
2
yr
1
is
simulated at SC and F
w
>1gm
2
d is reached up to 9dyr
1
. F
d
exceeds 0.1 gm
2
yr
1
for only 910 dyr
1
, with a maximum of 1.24g
m
2
yr
1
at SL. Most of highest deposition events and annual
deposition occur during March-May. Summer fallout never exceeds
0.25 gm
2
d
1
. The simulated seasonal cycle is consistent with
observations (5,6).
Laboratory experiments support an increase of 8 mgChlm
2
(or
0.08 mgChlm
3
in a surface mixed layer of 100m) per gm
2
of dust
deposition (7)with a lag time of ~48 hours (8). For a summer dust
deposition of 0.1 gm
2
in a mixed layer of 20m, the expected
increase is 0.04 mgChlm
3
. Our data set shows in accordance
0.020.16 mgm
3
increases in [Chl] shortly following dust fallout, and
thus supports a dust fertilization of Mediterranean waters.
However, we also find a good correspondence between high surface
winds and [Chl] peaks, and dust events are generally associated with
wind peaks (Fig.2). Surface wind controls the mixing between
surface waters and deeper ones, richer in nutrients. Observed [Chl]
increases can thus be contributed by both dust deposition and wind.
Coupled biogeochemical-circulation model and appropriate in situ
measurements are necessary to unravel both effects.
Fig. 2. Daily dust deposition, daily and 7d averaged chlorophyll, and
wind speed at SC, between February 1 and June 30, 1998.
Acknowledgement.This work was supported by the French Space
Agency (CNES).
References
1-Bergametti G., et al., 1992. Source, transport and deposition of
atmospheric phosphorus over the northwestern Mediterranean. J. Atmos.
Chem., 14: 501-513.
2-Ridame C., and Guieu C., 2002. Saharan input of phosphate to the
oligotrophic water of the open western Mediterranean Sea. Limnol.
Oceanog., 47: 856-869.
3-http://seawifs.gsfc.nasa.gov/SEAWIFS.html
4-Bauer S.E., et al.,in press. Global modelling of heterogeneous
chemistry on mineral aerosol surfaces: The in?uence on tropospheric
ozone chemistry and comparison to observations. J. Geophys. Res.
5-Nihlén T., et al.,1995. Monitoring Saharan dust fallout on Crete and its
contribution to soil formation. Tellus, 47B: 365-374.
6-Kubilay N., et al.,2000. An illustration of the transport and deposition
of mineral dust onto the eastern Mediterranean. Atmos. Environ., 34: 1293-
1303.
7-Ridame C., and Guieu C., 2002. Saharan input of phosphate to the
oligotrophic water of the open western Mediterranean Sea. Limnol.
Oceanog., 47: 856-869.
8-Ridame C., 2001. Rôle des apports atmosphériques d’origine
continentale dans la biogéochimie marine: Impact des apports sahariens
sur la production primaire en Méditerranée. PhD diss., Univ. Paris-6.