Rapp. Comm. int. Mer Médit., 37,2004
231
RESPIRATION AND VERTICAL CARBON FLUX FROM WATER COLUMN ETS ACTIVITY
T.T. Packard
1*
and J.P. Christensen
2
1
Institut de Cičncies del Mar; Pg. Marítim Barceloneta, 37-49; 08003 Barcelona, Spain -* ted@icm.csic.es
2
Bigelow Laboratory, W. Boothbay Harbor, ME 04575, USA - jchristensen@bigelow.org
Abstract
Carbon ?uxes were calculated by integrating water column respiration from 30, 50 and 100 m to the bottom in the Gulf of Maine. These
?uxes were 3, 2, and 1
µ
mol C min
-1
m
-2
. Profiles of respiration ranging from 10 to 680 p mol O
2
L
-1
min
-1
over water columns as deep
as 275 m were best described by power functions. Respiration correlated well with seawater turbidity and chlorophyll.
Keywords: electron transport, CO2 production, O2 consumption, metabolism
Carbon ?ux in the ocean can be calculated directly from sediment
trap measurements and indirectly from models, the
234
Th/
238
U
method, and the vertical profile of plankton respiration (R). We
integrate respiration depth profiles (R = f (z)) to calculate carbon ?ux
(F). F =
?
R dz =
?
f(z) dz. The calculations do not include benthic
respiration, benthic carbon burial, or the respiration of large plankton
and nekton. Nevertheless, they represent 90% of the total carbon ?ux.
Here we use Gulf of Maine ETS activity measurements to calculate
vertical profiles of the oxygen utilization rate and vertical carbon
?uxes from 30, 50, and 100 m depth.
ETS activity was measured by tetrazolium reduction in cell-
free extracts from ocean particulate matter (1).Respiration
(pmol O
2
h
-1
L
-1
) was calculated from the relationship between the
ETS activity and seawater respiration for the euphotic zone of the
Gulf of Maine. This unitless ratio of R-ETS activity is 0.260.
Respiration increased from the surface to some subsurface maximum
near the chlorophyll maximum (Fig. 1). Then it decreased by a factor
of 20-50 as an inverse power function through the thermocline. Below
it decreased more gradually and near the bottom it tended to increase.
Fig. 1. Co-varying profiles of respiration, turbidity, and chlorophyll at
Scotia shelf station 42. The units of respiration are n mol O2 L
-1
min
-1
, and
for chlorophyll they are mg L
-1
, turbidity is unitless. However, for scaling
purposes, chlorophyll values have been divided by ten, and those for
turbidity divided by 25. Inset: Profiles of respiration turbidity, and
chlorophyll at Chattam Shelf station 14. The scaling factors and the units
are the same as in the surrounding figure for station 42.
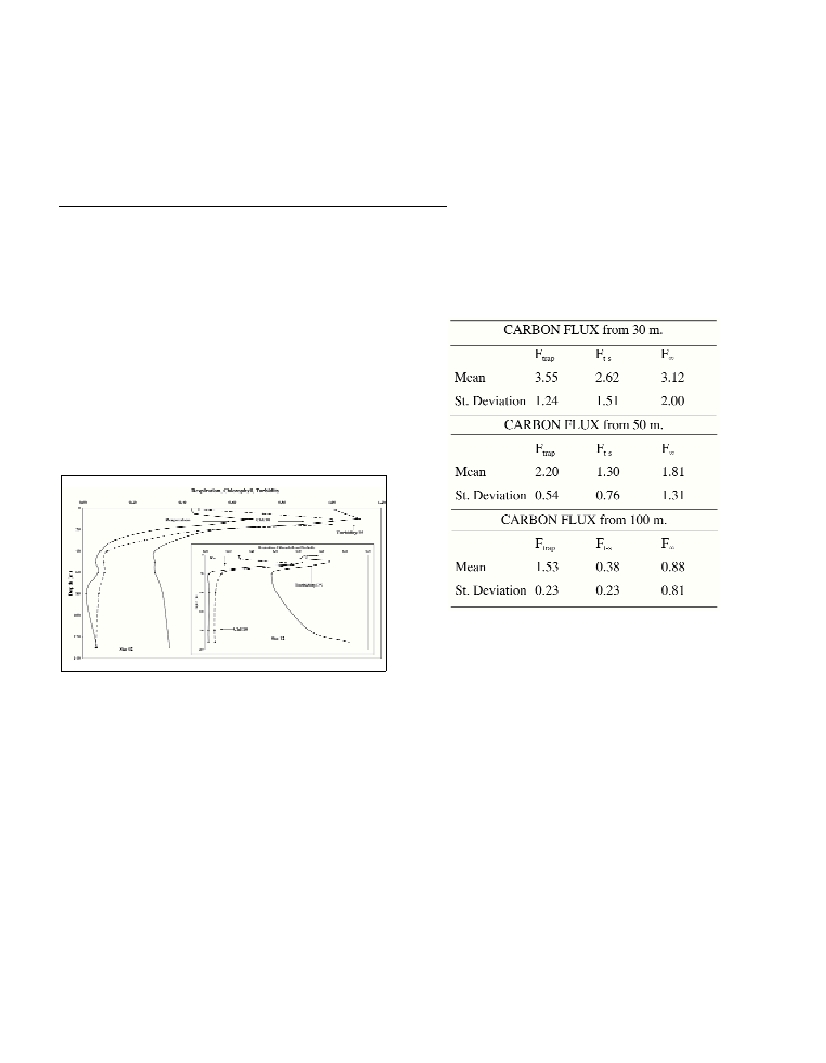
Carbon ?ux was calculated in three ways. (1) We integrated
respiratory CO
2
production rates from either 30, 50, or 100 m to the
bottom by trapezoidal approximation (F
trap
). (2) We integrated the
respiration-depth function as a definite integral from the upper depth
(i.e. 30m) to infinity as the bottom depth. (3) We used the depth of the
bottom as the lower boundary for the definite integral. The carbon
?uxes from the 30 m level average 3.55
µ
mol C min
-1
m
-2
by
trapezoidal approximation, 2.62
µ
mol C min
-1
m
-2
by integrating
equation 1 to the bottom, and, 3.12
µ
mol C min
-1
m
-2
by solving
equation 2 for s=
8
. Other integrations are presented in Table 1.
By the
238
U /
234
Th method, carbon ?uxes from the 50, and 100 m
levels in the Gulf of Maine range from 0.2-25 (2), and 1.4-17 (3)
µ
mol C min
-1
m
-2
. Our ?uxes from the 50 m and the 100m level
range from 1.3 to 2.2 and 0.38 to 1.53
µ
mol C min
-1
m
-2
(Table 1).
These fall in at the low end of wide range of ?uxes from the
238
U /
234
Th method. Note that the time scale inherent to each method
is different. Fluxes from ETS activities and
238
U to
234
Th decay are
based on minute-scale changes, ?uxes from
3
He-
3
H method are based
on annual-scale changes, and ?uxes from sediment traps are based on
day-to-month scale changes. Thus, to compare the short-time-scale
methods with the long-time-scale ones, time-series data for the short-
time-scale methods is needed.
Table 1. Carbon ?ux (F
c
) from 30, 50,and 100 m (z
t
) in the Gulf of Maine.
Mean values from 5 stations are presented.
(1) F
trap
, is F
c
from the upper boundary (z
t
) calculated by trapezoidal
approximation. The bottom respiration value used in this calculation was
the same as the minimum measured value at each station. (2) F
t-s
is the
integration of the normalized power function, R
z
= R
c
(z/z
t
)
b
between z
t
and
the bottom depth (z
s
). F
t-s
= [R
c
/((1+b)(z
t
)
b
)] [(z
s1+b
) - (z
t1+b
)]. (3) F
8
is
the integration of the same equation between the z
t
and infinity. All three
calculations represent the portion of the F
c
that is oxidized in the water
column below z
t
. All F
c
values are given in m mol C min
-1
m
-2
.
References
1-Packard, T.T. and Williams, P.L.B. 1981. Rates of respiratory oxygen
consumption and electron transport in surface seawater from the northwest
Atlantic Ocean. Oceanologica Acta,4: 351-358.
2-Benitez-Nelson, C., Buesseler, K.O. and Grossin, G. 2000. Upper
ocean carbon export, horizontal transport, and vertical eddy diffusivity in
the southwestern Gulf of Maine. Continental Shelf Res.,20: 707-736.
3-Charette, M.A., Moran, S.B., Pike, S.M. and Smith, J.N. 2001.
Investigating the carbon cycle in the Gulf of Maine using the natural tracer
thorium-234. J. Geophysical Res., 109: 11,553-11,579.