Rapp. Comm. int. Mer Médit., 37,2004
242
CHEMISTRY OF THE SEA SURFACE MICROLAYER IN THE BLACK SEA
G. Shtereva*, B. Dzhurova, O. Hristova
Institute of Oceanology, BAS, PO Box 152, 9000Varna, Bulgaria - * chem@io-bas.bg
Abstract
The study is based on bi-monthly monitoring in Varna Bay, which is affected by anthropogenic pressure. Nutrients (TP, IP, N
NO2
, N
NO3
,
Si), suspended matter, oxidizability, metals (Fe, Mn) were measured in both layers: SL and SML. A maximum accumulation for most of
investigated parameters in Summer-Autumn period was observed. The highest coefficient of accumulation for nitrate N was established.
Keywords: Black Sea, nutrients, oxidizability, surface microlayer
As an area of exchange of matter and energy, the sea surface
microlayer (SML) is an important boundary that either affected by
global change. The sea SML has unique chemical and biological
characteristics very different from those of underlying water. This thin
sea-surface film receives material input from atmospheric,
terrigeneous and marine sources, leading to elevated concentrations of
both natural compounds and anthropogenic contaminants (1). There is
still a lack of knowledge about phisico-chemical processes governing
the formation and properties of SML and. The aim of the study is to
assess the capacity of SML to accumulate nutrients and organic
matter.
The study is based on bi-monthly monitoring at one station in Varna
Bay, one of the most affected by anthropogenic pressure regions along
the Bulgarian Black Sea coast. The following parameters: total
phosphorus (TP), inorganic phosphorus (IP), nitrite and nitrate
nitrogen (N
NO2
, N
NO3
), silica (Si), suspended matter (SM),
oxidizability Fe and Mn were determined by standard methods. The
accumulation in SML is presented by ratio between concentration in
SML and surface (SL): Ka=C
SML
/C
SL
.
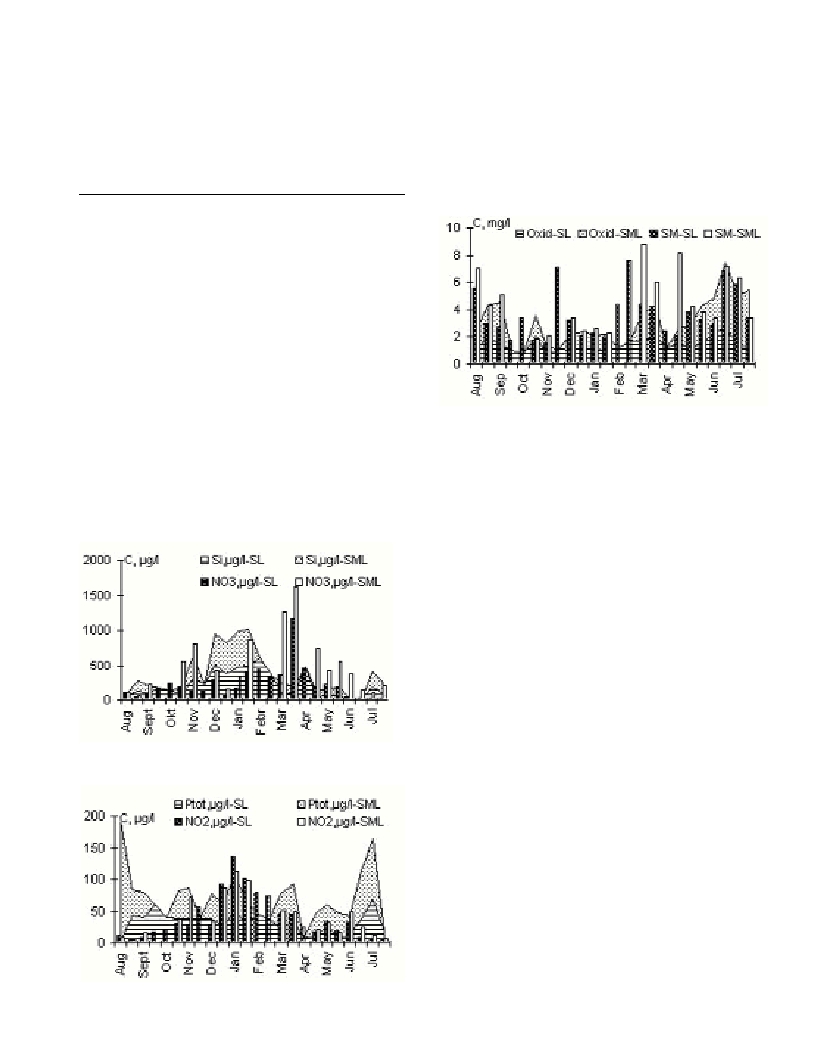
The data reveal that sea SML is enriched in organic and inorganic
substances relative to the surface water. The nutrients distribution in
SML follows that in SL (Figs.1, 2). Their microlayer concentrations
occasionally exceed the permissible limits (Water quality criteria for
the coastal sea water). The comparison of nutrients distribution in SL
and SML shows a good correlation for N (r
2
=0.47). A similar situation
is observed for SM (r
2
=0.45). According to the coefficient of
accumulation (K
a
) the microlayer enrichment for N during all seasons
is the highest. Maximum of K
a
for the whole period of investigation
is as follows: 8 for N
NO3
; 2.8 for N
NO2
; 4 for TP and oxidizability; 3
for IT; 2 for SM, 5 for Fe and 9 for Mn). The coefficient of
accumulation for metals, phosphorus and SM is comparable with
those found in other area, where similar investigations were carried
out (2,3). Concerning inner annual distribution, we can note, that the
more significant enrichment of the SML (with exception of
phosphorus) was established during the summer–autumn period (Figs.
1, 2, 3). The calculated N/P ratio is the highest in both layers in
March, when maximum N-content was detected. Analogously,
maximum Si/P ratio was in January, in relation to Si content,
respectively.
The data presented suggest the following conclusions, which at the
stage of investigation should be considered preliminary:
A microlayer enrichment for all parameters (nutrients and organic
matter) is observed. The capacity of SML accumulation for N is the
highest in comparison with the other nutrients. The seasonal
distribution is characterized with maximum accumulation for most of
investigated parameters in Summer-Autumn period. These
preliminary results could be used for subsequent investigations to
improve our understanding of the processes at natural phase
boundaries.
References
1-Hardy, J. 1999. Biolody, contamination and toxicity of the sea surface.
CIESM WorkshopSeries,9: 41-44.
2-Shtereva, G. 1998. Total and organic suspended matter in the Black Sea
water of the thin surface microlayer. Proceedings of IO, 2: 27-31.
3-Shtereva, G. 2000. Contaminant accumulation in the sea surface
microlayer, J. of Balkan Ecology,v.5, 2:196-200.
Fig.1. Silica and nitrate N in the surface microlayer (SML) and surface
layer (SL).
Fig.2. Total P and nitrite N in the surface microlayer (SML) and surface
layer (SL).
Fig.3. Oxidizability and SM in the surface microlayer (SML) and surface
layer (SL).