MICROPHYTOPLANKTON COMPOSITION ACROSS THE FRONTAL SYSTEM
IN THE NORTHEN ADRIATIC (FEBRUARY, 2003)
Cetinic I.
1*
, Vilicic D.
1
, Buric Z.
1
1
Division of Biology, Faculty of Science, University of Zagreb, Rooseveltov trg 6, PO Box 333, Zagreb, Croatia - * icetinic@botanic.hr
Abstract
Microphytoplankton composition was analysed along two transects: Po-Novigrad (PoN) and Pula – Rimini (PR) in the Northern Adriatic
Sea, during February 2003. The PR transect was highly in?uenced by the freshwater discharge from the Po River. A complex frontal sys-
tem was defined gradients in salinity, temperature and microphytoplankton composition. Thermohaline gradients along the PR transect
were stronger than that along the PoN transect. According to salinity affinity, PCA analysis of species abundance reveals the presence of
4 characteristic groups of phytoplankton in the northern Adriatic.
Keywords: phytoplankton, Northern Adriatic, salinity, temperature
Rapp. Comm. int. Mer Médit., 37,2004
270
Introduction
Phytoplankton responses to freshwater inputs in the Northern
Adriatic have been studied during the last 30 years. The Northern
Adriatic is strongly in?uenced by freshwater in?ow from the Po
River, with an average yearly discharge of 3600 m
3
s
-1
(1). The results
presented in this study describe winter aspect of the phytoplankton
community structure in the Northern Adriatic.
Materials and methods
Twenty-six surface water samples were taken along two transects
(PoN and PR) in the Northern Adriatic during a cruise aboard R/V
Knorr(KN 172-03) between 2-3 February 2003 (Fig.1). Water
samples for phytoplankton analysis were preserved in 2% neutralized
formaldehyde (final concentration). The phytoplankton abundance
was determined according to the inverted microscope method (2).
Salinity and temperature were measured underway by the IMET
meteorological sensor system.
Results and discusion
Strong in?uences by the river Po could be noticed in salinity and
temperature dynamics, as well as microphytoplankton abundance
across PR transect (Fig. 2). Along the PoN transect, the Po River
in?uence was detected through the frontal system of less pronounced
gradients. In both cases microphytoplankton were more abundant in
water masses of lower salinity, due to nutrient enrichment by the Po
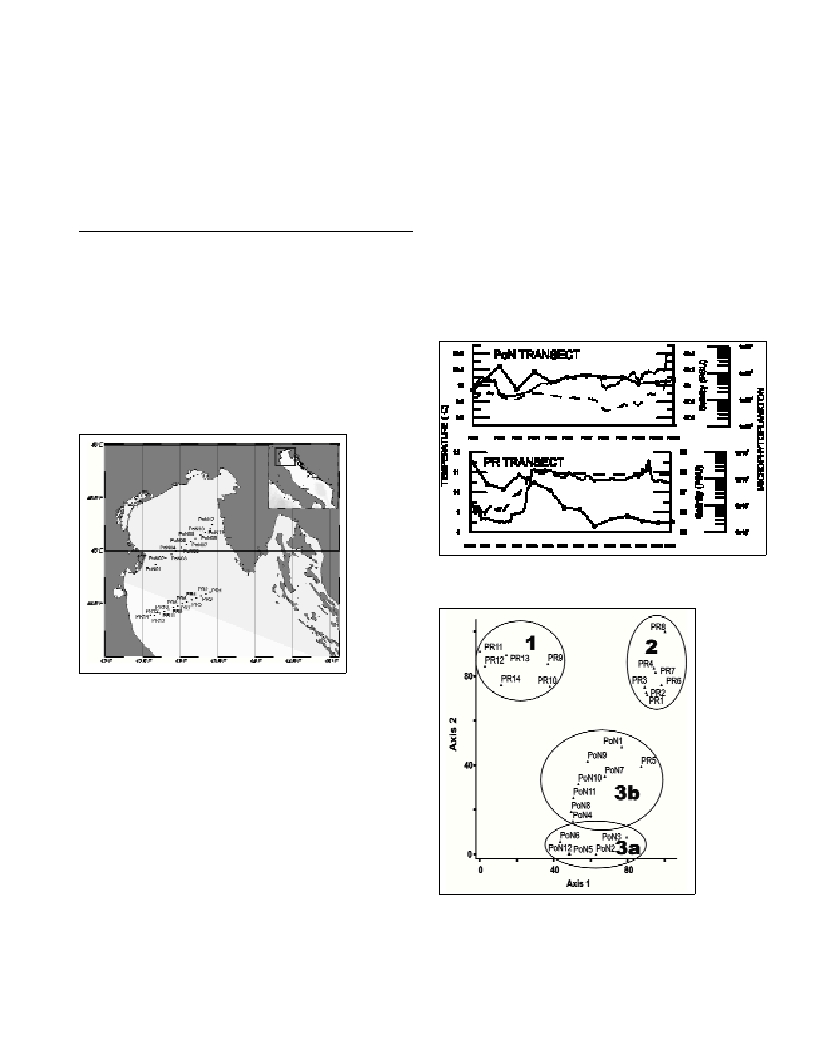
River (1). Principal component analysis on species abundance data
revealed the presence of 4 groups (Fig. 3). The first group, strongly
influenced by river Po, was dominated by Thalassionema
nitzschioidesand Dictyocha fibula. The second group was dominated
by the diatoms Skeletonema costatum, Chaetoceros danicusand some
larger dino?agellates such as Ceratium furca, Noctiluca scintilans and
Gymnodinium “simplex”.The smaller dino?agellate Gyrodinium sp.
and the diatom Pseudonitzschia sp.were also present in the second
group as well as in groups 3a and 3b. Group 3a was dominated by the
diatoms Cerataulina pelagica, Chaetoceros danicus, Diploneis
bombus, Lioloma pacificumand silico?agellate Dictyocha fibula.
Group 3b, consisting of samples from PoN and one sample from PR
transect, could be connected to higher salinity gradients along the
PoN transect. Group 3b was dominated by Chaetoceros danicusand
Nitzschia longissima/Cylindrotheca closterium. It is concluded that
Pseudonitzschia spp. andGyrodinium sp.,as well as all the species
found in group 1are typical representatives of the Northern Adriatic
winter phytoplankton community in higher salinity waters. Dictyocha
fibula could be considered as representative of the lower salinity
community. Other species found in group 3a are considered as species
tolerant to lower salinity, but require less turbulent conditions than
those found in the proximity of the Po estuary.
Fig. 2. Salinity (dashed line), temperature (solid line) and microphyto-
plankton abundance (line with dotes) on PoN and PR transects.
References
1-Degobbis, D. and Gilmartin, M., 1990. Nitrogen, phosphorus and
biogenic silicon budgets for the northern Adriatic Sea. Oceanol. Acta, 13:
31-45.
2-Utermöhl, H., 1958. Zur Vervollkommnung der quantitativen
Phytoplankton Methodik. Mitt. Int. Ver. Theor. Angew. Limnol.,9: 1-38.
Fig.1.
Northern
Adriatic
area and
sampling
locations.
Fig. 3. PCA
plot showing
distribution of
PoN and PR
samples. 1,
2, 3a and 3b
are groups
defined by
PCA analysis.