SHORT-TERM VARIABILITY OF ZOOPLANKTON BIOMASS AND SIZE STRUCTURE
IN THE NORTHWESTERN MEDITERRANEAN
M. Alcaraz
1
*, A. Calbet
1
, X. Irigoien
2
, I. Trepat
1
and E. Saiz
1
1
Institut de Cičncies del Mar, CSIC, Barcelona, Spain - * miquel@icm.csic.es
2
AZTI, Herrera Kaia portualdea z/g 20110 Pasaia (Gipuzkoa), Spain
Abstract
The short-term variability of phyto- and mesozooplankton biomass and size structure was estimated at different time and space scales in
the NW Mediterranean. Three stations representative of contrasting hydrographic structures were repeatedly sampled for zooplankton,
hydrographic parameters and phytoplankton (chlorophyll a
) in a 12 day period. Although the variability for all the parameters was higher
at the shorter time- and space scales (hours, meters), the rate of change at larger scales must be carefully considered.
Key Words: Plankton biomass, variability, Catalan Sea
Rapp. Comm. int. Mer Médit., 37,2004
306
Introduction
Plankton production models require reliable parameterisations of
extensive properties like biomass and size spectrum, both known to
display changes at broad time and space scales. At some scales,
variability can be interpreted according to Stommel’s classical
diagram of plankton variability (1). In the case of zooplankton, part of
this variability, mainly that derived from predictable sources (i.e., tidal
currents, light-induced activity rhythms, etc.) is generally considered
to be avoided by adequate sampling schedules, while other sources of
variability are seldom considered. In this study, the variability at
different spatial (meters - tens of Km) and temporal (hours - weeks)
scales of phyto- and zooplankton biomass and size are estimated and
discussed in the light of the contrasting hydrographic properties
related to a persistent density front in the Catalan Sea (NW Mediter-
ranean).
Study area and methodology
Plankton was studied along a transect (VARIMED-95 cruise, June
1995) off Barcelona (Fig. 1), crossing the Catalan density front (2).
Three stations, representative of contrasting hydrographic structures
(Coastal C, Frontal F,and Offshore Ostations, Fig. 1), were sampled
every four days during the 12 days cruise, at 4-6 hr interval.
Zooplankton was collected using a Longhurst-Hardy Plankton
Recorder net fitted with 200 µm-mesh. Four to seven depths from
surface to 100 m were sampled in each cast. Hydrographic data were
simultaneously obtained with a Seabird CTD installed in the net.
Chlorophyll a
(Chl a
) data were obtained from the in vivo?uorescence
profiles after adequate ?uorometer calibration.
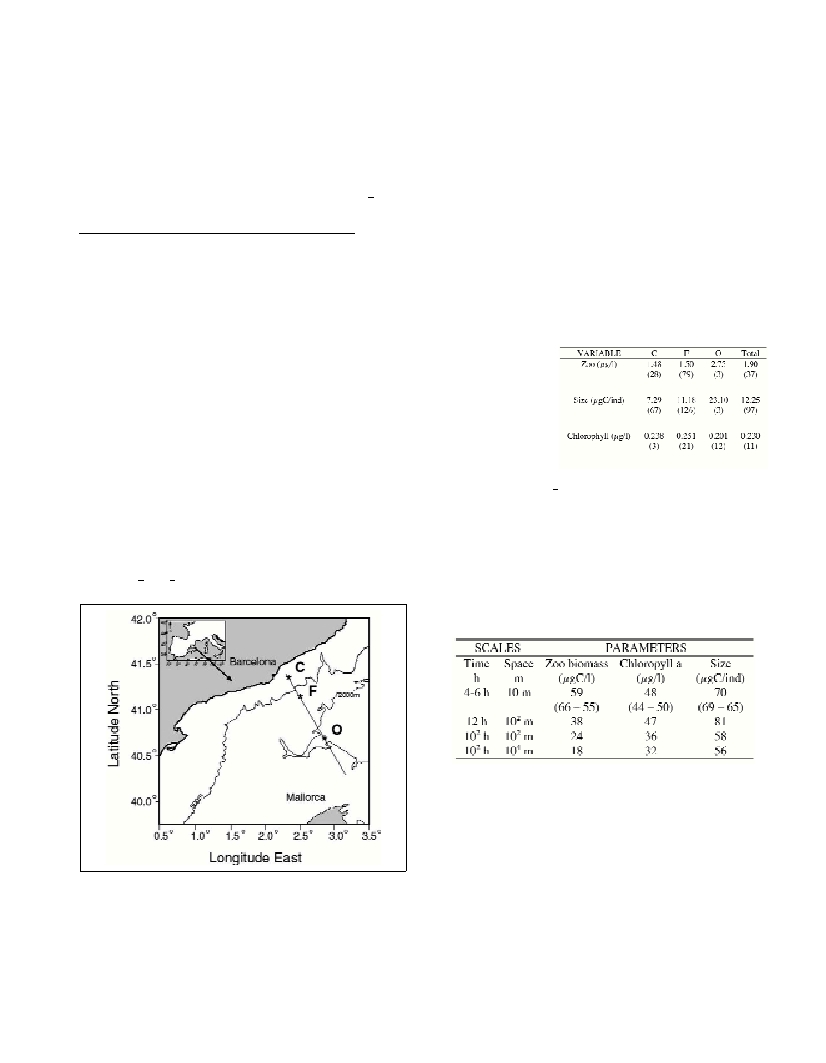
Fig. 1. Map showing the position of Coastal, Frontal Offshore stations in
the study area.
Zooplankton biomass (as organic C and N) was analysed on
aliquots from the corresponding depth-samples obtained on each cast
using a Carlo-Erba C – H - N analyser. Zooplankton community size
structure was obtained by image analysis. Zooplankton biomass data
have been expressed as µg C l
-1
, and average individual size as
µgC/ind., according the distribution of organisms in 13 biomass-
classes in a doubling scale (log
2
) (3).
Results and discussion
Zooplankton biomass and individual size showed similar trends,
increasing from coastal to offshore stations (Table 1), while the
highest concentrations of chlorophyll corresponded to the front. All
structural properties here considered (Table 1) were significantly more
variable at front, as expected by the higher dynamism in frontal areas
as observed and discussed in (4).
Zooplankton and Chl a
tended to vary inversely with time and space
scales, the first being less variable during the night than during
daylight hours (Table 2). At all time and space scales, the highest
variability corresponded to individual size, particularly for 12 hr –tens
of meters time-space scales due to the arrival in the sampling area of
larger individuals during the night (vertical migration). Apart from
this relatively high frequency variability, other variability sources
acting at different time- and space scales are particularly important,
and must be carefully considered in plankton production models.
Acknowledgements
This work has been financially supported by Spanish grants
AMB94-1019 and REN2001-1693/MAR to M.A. and E.S. We thank
all the participants to the VARIMED-95 cruise.
References
1-Haury I.R., Mc Gowan J.A., and Wieve P.H., 1978. Patterns and
processes in the time-space scales of plankton distributions. In: Steele J.H.
(ed.), Spatial pattern on plankton communities. Plenum Press, N.Y.
2-Estrada M., and Margalef R., 1988. Supply of nutrients to the
Mediterranean photic zone along a persistent front. In: Minas H.J., and
Nival P. (eds.), Océanographie pélagique méditerranéenne. Oceanol. Acta.
3-Alcaraz M., Saiz E., Calbet A., Trepat I. and Broglio E., 2003.
Estimating zooplankton biomass through image analysis. Mar. Biol., 143:
307-315.
4-Calbet A., Alcaraz M., Saiz E. and Estrada M., 1996. Planktonic
herbivorous food webs in the Catalan Sea (NW Mediterranean): temporal
variability and comparison of indices of phyto-zooplankton coupling
based in state variables and rate processes. J. Plankton Res., 18: 2329-
2347.
Table I. Average values
and variability (C.V., %,
in parenthesis) at the
Coastal (C), Frontal (F)
and Offshore (O) stations
for Zooplankton biomass
(µgC/l), Individual size
(µgC/ind) and Chloro-
phyll a (µg/l), at time-
and space scales of
102 h and 102 m).
Table II. Variability (C.V., %) of Zooplankton biomass (µgC/l), Individual
size (µgC/ind) and Chlorophyll a (µg/l) at different time- and space scales.
In parenthesis (day – night) values.