SEASONAL DIFFERENCES IN THE GROWTH OF PILCHARD SARDINA PILCHARDUSLARVAE
IN THE CATALAN SEA (NW MEDITERRANEAN).
I.A. Catalán, M.P. Olivar *, I. Palomera, E. Berdalet, C. Roldán and B. Aguilera
Institut de Cičncies del Mar, Barcelona, Spain - * polivar@icm.csic.es
Abstract
The long- and short-term growth of 3.5 to 16 mm standard length Sardina pilcharduslarvae was compared between two cruises conducted
in autumn and winter in the Catalan Sea (NW Mediterranean). Growth was significantly higher in November than February, as assessed
by muscle fibre recruitment and RNA/DNA ratios. Otolith age-length relationships suggested a similar trend. Sea temperature is regarded
as a plausible explanatory factor for the differences in growth.
Keywords: Sardina pilchardus, larvae, growth, NW Mediterranean, temperature
Rapp. Comm. int. Mer Médit., 37,2004
330
Peak spawning of Sardina pilchardus in NW Mediterranean occurs
in the unstable autumn-winter season (1). Although variations in
environmental factors are known to affect both distribution and
abundance of pilchard larvae in this area (2, 3), there is little
information on the possible effects of environmental conditions on
larval biological parameters and their possible relationship to survival.
The objective of the present study was to test the hypothesis that
long- or short-term growth does not differ between two seasons
(autumn and winter) characterised by marked differences in mean
water temperature and comparable mean concentrations of potential
food items.
Two cruises were conducted, in the Catalan Sea in November 1998
and February 1999. Long-term growth was estimated by (a) age-
length relationships, and (b) the variation of fast muscle fibre
numbers. The rationale for the latter method, seldom used in field
studies, is that small differences in environmental variables
(particularly temperature) during egg and early larval stages are
known to alter muscle hyperplasia and/or hypertrophy, thus modifying
larval growth (4, 5). Short-term growth was assessed through
RNA/DNA ratios, based on the method described by Deniel (6).
Mean sea surface temperature in November 1998 (Mean=19.2şC,
SE=0.007) was
about 6
°
C higher
than in February
(Mean=12.9şC,
SE=0.07)). The
analysed larvae
were collected
from areas where
the median values
of copepod nauplii
were between 4.4
nauplii l
-1
(Nov-
ember) and 6.3
nauplii l
-1
(Feb-
ruary). The vertical
profiles of mean
temperature in the
depth-range inhabited by pilchard larvae (2) showed a strong
thermocline in November. It is believed that relative temperature
differences between cruises were maintained during all
developmental history of the larvae (based on AVHRR data: 7).
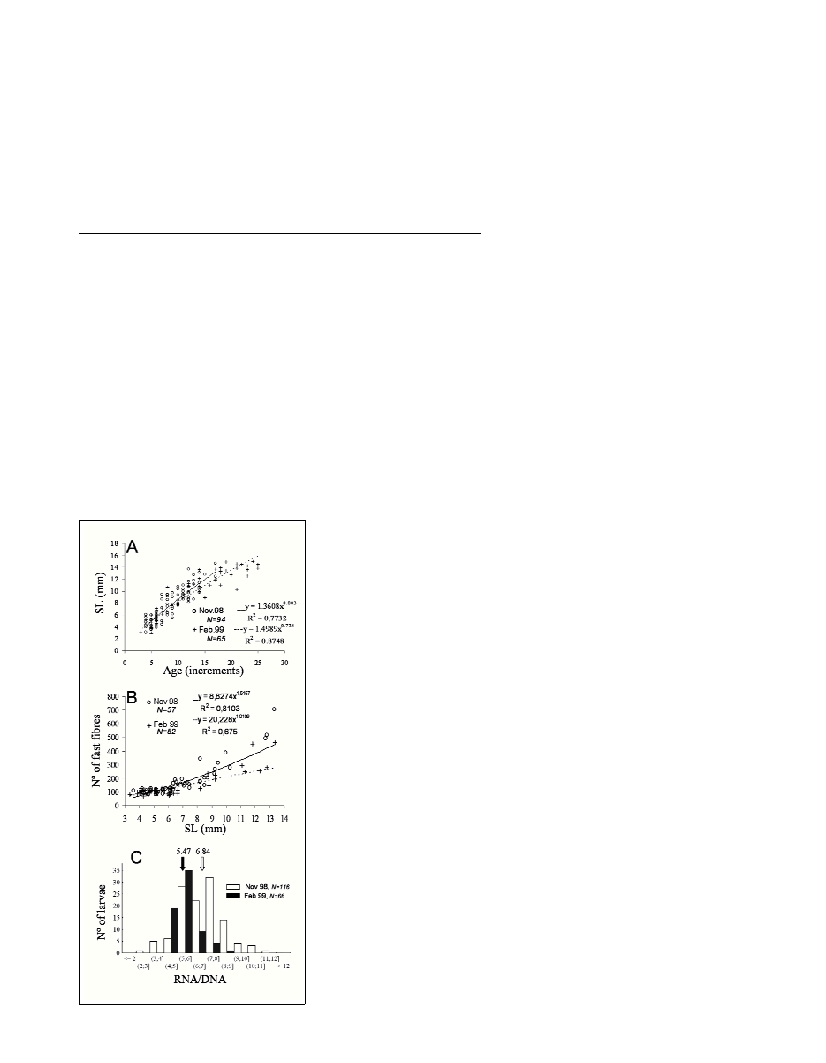
Long-term measures of growth indicated that pilchard larvae
exhibited higher growth rates in November than in February. For both
otolith and muscle-derived data, the slopes of the regression lines
were compared between periods by testing the significance of the
interaction term in a crossed two-way ANOVA with covariates (age or
length) performed on appropriatedly standardised variables for GLM
analysis. Although no significant difference in the slopes could be
established between cruises for the age-length data at an
a
=0.05, the
qualitative observation of the data (Fig 1A) suggest that November
larvae tended to be younger (faster-growing) for a given length (Fig.
1 A). This hypothesis is strengthened by the significantly higher
recruitment of fast muscle fibres in November respect to February
(Fig. 1B), as shown by the significant interaction term in the ANOVA
(interaction term: “year x total length” length used as a covariate,
F
1,106
=13.43, p<0.001).
The median RNA/DNA ratio in November was also significantly
(Mann-Whitney W=4174, p<0.0001) higher than in February, which
reinforces the results of the long-term growth analyses (Fig. 1C).
It is concluded that the 6şC difference in temperature between the
two periods could account for the observed higher growth estimates in
November than in February. However, the effect of changes in species
composition of potential prey in February, related to the long
persistence of a mesoscale eddy near the study area (7), cannot be
ruled out. The slower growth of winter-spawned larvae could have
negative consequences for survival to juvenile stages. Individuals
would remain longer in the planktonic phase, which as noted elswhere
(8) could increase the predator-induced accumulated mortality.
References
1-Palomera I., Olivar MP., 1996. Nearshore ichthyoplankton off the
Costa Brava (Northwest Mediterranean). Bol. Inst. Esp. Oceanogr., 22:
71-76.
2-Olivar MP., Salat J., Palomera I., 2001. Comparative study of spatial
distribution patterns of the early stages of anchovy and pilchard in the NW
Mediterranean Sea. Mar. Ecol. Prog. Ser., 217: 111-120.
3-Olivar MP., Catalán IA., Emelianov M., and Fernández de Puelles ML.,
2003. Early stages of Sardina pilchardusand environmental anomalies in
the NW Mediterranean. Est. Coast. Shelf Sci., 56: 609-619.
4-Stoiber W., Haslett JR., Sänger A.M., 1999. Myogenic patterns in
teleosts: what does the present evidence really suggest? J. Fish Biol., 55:
84-99.
5-Johnston IA., Temple GK., Vieira VLA., 2001. Impact of temperature
on the growth and differentiation of muscle in herring larvae. Pp. 99-120.
In: Thorndyke D.A.M.. (ed), Environment and Animal Development:
Genes, Life Histories and Plasticity. BIOS Scientific Publishers Ltd.,
Oxford.
6-Berdalet E., 2002. Quantization of nucleic acids in marine
microplankton samples Pp. 271-289. In: Pelagic Ecology Methodology.
Subba Rao D.V. (ed). A.A. Balkema publishers.
7-Pascual A., et al.,2000. Detection by altimetry and AVHRR images of
fan intense anticyclonic eddy in the Balearic Sea. Proc. Int. Soc. Opt. Eng.,
4172: 31-36.
9-Hunter, J.R., 1981. Feeding ecology and predation of marine larvae.
Pp. 34-77. In: Lasker, R. (ed), Marine fish larvae: morphology, ecology
and relation to fisheries, Univ. of Washington Press, Seattle.
Fig. 1.
Comparison of long
and short-term
growth of Sardina
pilcharduslarvae in
November 1998 and
February 1999. (A)
Relationship
between estimated
age and standard
length. (B)
Relationship
between standard
length and total
number of fast
fibres, per
transverse section
of myotomal
muscle. (C)
Frequency
distributions of
RNA/DNA ratio
values. Arrows
indicate medians.