DEMERSAL FISH ASSEMBLAGES FROM THE CONTINENTAL SHELF
AND UPPER SLOPE TRAWLING GROUNDS OFF SE SPAIN (WESTERN MEDITERRANEAN)
A. M. Fernßndez
1
* and M. GarcÝa-RodrÝguez
2
1
IEO. Centro Oceanogrßfico de Murcia, Pedro del Pinatar, Spain - * angel.fernandez@mu.ieo.es
2
IEO. Servicios Centrales. Madrid , Spain
Abstract
The continental shelf and upper slope fish communities off SE Spain were studied based on data collected during the LEDER cruise in
June 2002. Cluster and MDS analysis allowed the identification of four groups of hauls related to depth, which result in well defined
communities. Similarity percentage analysis was used to identify the most discriminating species between communities. Ecological
parameters are provided for comparison with other areas.
Key-Words: Fish assemblages, Demersal communities, Western Mediterranean
Rapp. Comm. int. Mer MÚdit., 37,2004
353
Introduction
Fish communities and the bathymetric distribution of their species
are well known in some areas of the Spanish Mediterranean specially
the Catalan Sea, the Balearic Islands and the Alborßn Sea (1,2,3). The
hydrological conditions of the continental shelf and upper slope off
SE of Spain could be considered transitional between the north-
western Mediterranean areas and the Alboran Sea. These
characteristics could affect species distribution and community
composition. The present study is the first analysis of the demersal
fish communities in this area.
Materials and methods
Data were collected in June 2002. A total of 54 samples (hauls)
were taken with the MEDITS sampling gear between depths of 36 and
578 m. Abundance and biomass data were transformed by double
square root to reduce the effects of extreme values. A total of 107
species were recorded but pelagic species from the continental shelf
and mesopelagic or bathypelagic species from the upper slope were
omitted from the analysis as well as species recorded only in a single
sample, since they could introduce some noise in the analysis. Cluster
analysis and multidimensional scaling (MDS) were used for grouping
similar samples. The PRIMER package (4) was used to carry out the
analysis, based on the Bray-Curtis similarity index, Complete Linkage
Clustering and UPGMA (Unweighted Pair-Group Mean Analysis). To
establish which species contribute to the (dis)similarity between
groups of samples, the SIMPER (similarity percentage analysis)
routine was used. To test the differences between groups of samples
an one-way layout ANOSIM test was employed. The ecological
parameters abundance, biomass, species richness (S), mean species
richness, Shannon-Wiener diversity index (H┤) and evenness (J┤) were
determined for each group identified by cluster and MDS analysis.
Results and discussion
Analysis made on biomass and abundance data showed similar
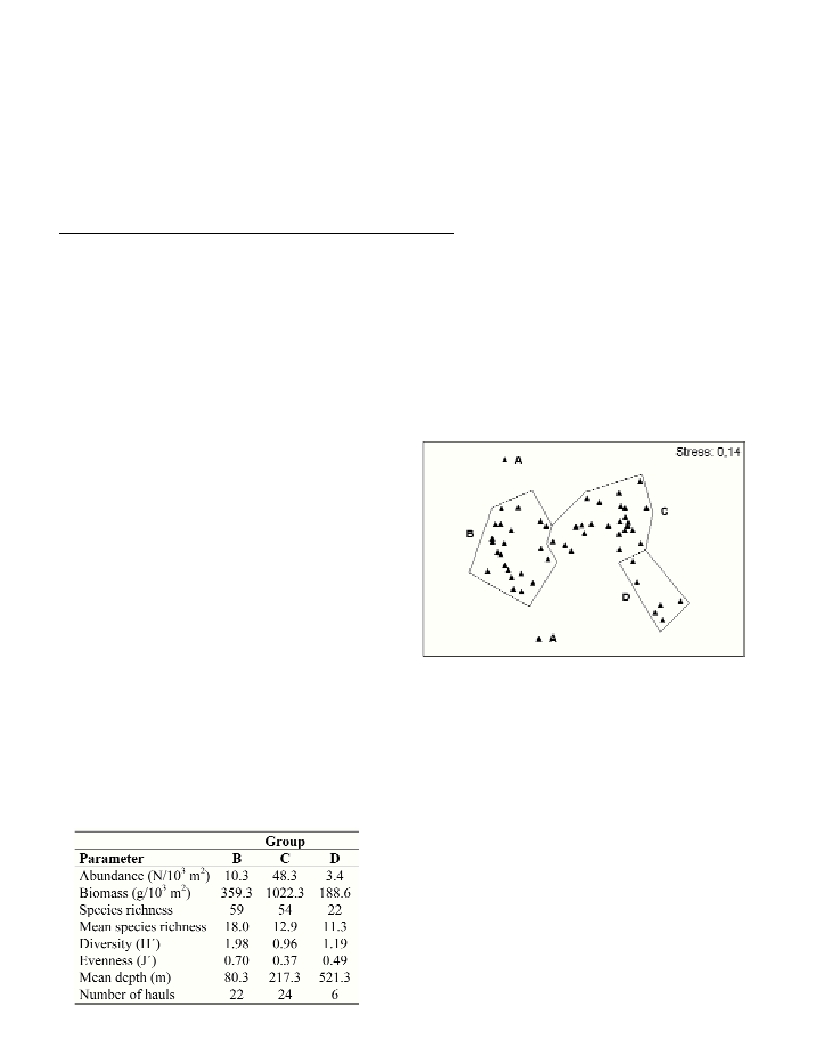
results. Cluster analysis and MDS (Fig. 1) showed four main groups
of samples clearly related to depth which correspond to shallow areas
(A), continental shelf (B), continental break (C) and upper slope (D)
respectively. Similar bathymetric pattern has been described in other
areas (1, 3). In shallow areas (less than 40 m deep) few samples were
taken due to the existence of rocky bottoms and Posidonia oceanica
sea-grass. The results of SIMPER for similarity within groups showed
that in group B the most characteristic species were Boops boops,
Mullus barbatus,Serranus hepatus, Spicara maena, Pagellus acarne,
Cepola macrophthalma, Mullus surmuletusand Lepidotrigla
cavillone.For group C, the most characteristic species were
Micromesistius poutassou, Helicolenus dactylopterus, Gadiculus
argenteusand Lepidopus caudatus.In the case of group D, the
characteristic species were Phycis blennoides,Lampanyctus
crocodilus, Galeus melastomus,Etmopterus spinax, Nezumia
aequalisand Hoplostetus mediterraneus. ANOSIM test (R=0.868;
significance level < 0.1%) confirmed the high dissimilarity between
these assemblages. Species richness (S), diversity (H┤) and evenness
(J┤) reached the highest values in group B whereas maximum values
of abundance and biomass were obtained for group C. Group D
showed the smallest values of abundance, biomass and S, but
intermediate values of Hĺand Jĺ(Table 1).
Fig.1. MDS plot of samples. Groups encircled by lines correspond to
those obtained by cluster analysis.
References
1-Demestre M., Sßnchez P., and Abellˇ P., 2000. Demersal fish
assemblages and habitat characteristics on the continental shelf and upper
slope of the north-western Mediterranean. J. Mar. Biol. Ass. U. K., 80:
981-988.
2-Gil de Sola L., 1994. Ictiofauna demersal de la plataforma continental
del mar de Alborßn (Mediterrßneo suroccidental ibÚrico). Bol. Inst. Esp.
Oceanog., 10 (1): 63-79.
3-MassutÝ E., Re˝ones O., Carbonell A., and Oliver P., 1996. Demersal
fish communities exploited on the continental shelf and slope off Majorca
(Balearic Islands, NW Mediterranean). Vie Milieu, 46(1): 45-55.
4-Clarke K.R., and Warwick R.M., 1994. Change in marine
communities: an approach to statistical analysis and interpretation.
Natural Environment Research Council, UK, 144 p.
Table 1. Ecological parameters of the groups of samples resulting from
cluster and MDS analyses (group A was not included because of the
small number of samples).