ACOUSTIC-GEOSTATISTICAL ASSESSMENT AND HABITAT¢ABUNDANCE RELATIONSHIPS
OF SARDINE IN THE HELLENIC SEAS
M. Giannoulaki
1
*, A. Machias
1
, C. Koutsikopoulos
2
, S. Somarakis
1,2
, N. Tsimenides
1
1
Institute of Marine Biology of Crete, Iraklio, Crete, Greece - * marianna@imbc.gr
2
University of Patras, Dept. of Biology, Patra, Greece
Abstract
Acoustic and environmental data from six research surveys (in summer and winter) in the Aegean and Ionian Seas were analysed to
examine the spatial structure of sardine populations using geostatistical techniques, and study the spatial distribution of sardine in relation
to environmental regimes using cumulative distribution function analysis. Geostatistical analysis showed that sardine formed meso- to
large-scale patches. Generally, within the range of available measurements, sardine was significantly (p<0.05) associated to more
productive inshore waters. This was more pronounced during the winter period.
Keywords: sardine, spatial distribution, geostatistics, environmental variable selection, Hellenic Seas
Rapp. Comm. int. Mer Mķdit., 37,2004
363
Introduction
In the Hellenic seas, sardine (SardinapilchardusWalb.) forms the
basis of commercially important fisheries comprising 11.4% of the
mean total marine landings (1). The knowledge of the spatial
organization of small pelagic fish stocks such as sardine is essential
because it may affect both stock catchability and the results of
assessment surveys and contributes to the understanding of
fundamental ecological processes affecting the population (2). The
present paper presents preliminary results on sardineÆs spatial
structure in the coastal waters of Hellas, as well as its association with
environmental parameters, based on the combination of data from
concurrent hydroacoustic and hydrographic surveys.
Materials and methods
Acoustic data were collected during four research surveys (summer
1998, 1999 and winter 1999, 2000) onboard the R/V Philia, carried
out along predetermined transects in the Central Aegean and Ionian
Seas. The acoustic equipment used was a Biosonic Dual Beam 120
kHz V-Fin Echosounder. Acoustic echoes were registered
continuously along transects and were integrated over one nm
(Elementary Distance Sampling Unit). Sardine echoes were
discriminated from those of other fishes by the characteristic
echogram shape of the schools and back-scattered energy of single
targets (3). Hydrographic sampling was performed over a grid of
predetermined stations. At each station vertical profiles of
fluorescence were obtained with a WetLabs fluorometer and
zooplankton samples with a WP2-net. The study area was divided into
seven sub-areas and geostatistical analysis was applied to study the
spatial structure of sardine populations (4). In addition, we used
cumulative distribution functions analysis (CDFs) to investigate the
spatial distribution of sardine in relation to environmental regimes (5).
Results and discussion
The estimated autocorrelation range of omnidirectional variograms
indicated that sardine formed meso- to large-scale patches (i.e.
autocorrelation range varied from 2 nm to 15 nm). Specifically,
sardine exhibited an autocorrelation range that generally agreed with
the one observed for other sardine species and sub-species [Sardinops
sagax:in the southern Benguella region
ś
10 nm (6), Sardina
pilchardus pilchardus:in the Catalan Sea and in the Bay of Biscay
ś
8 nm (2 and references therein)]. The smallest ranges (2 to 6 nm) were
observed in small gulfs (i.e. North Evoikos Gulf and Patraikos Gulf).
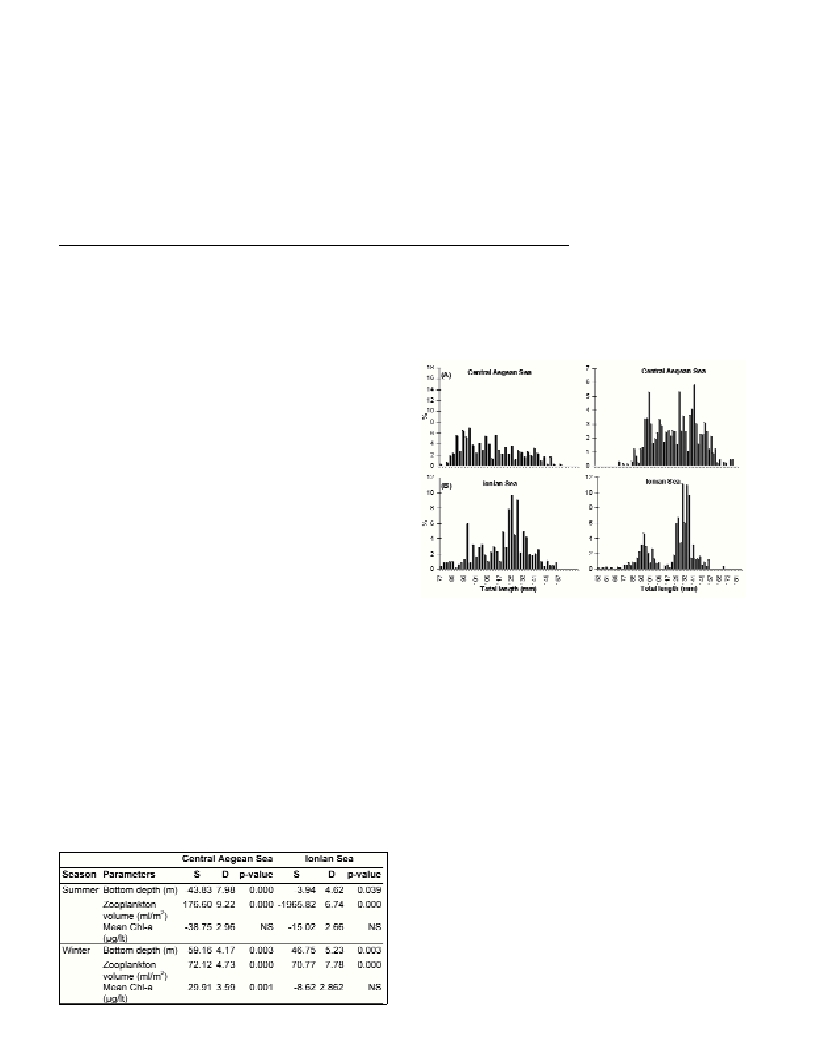
CDFs analysis (Table 1) revealed that sardine in the Central Aegean
Sea was significantly (p<0.05) associated to the more productive
inshore waters during summer, whereas the opposite was observed in
the Ionian Sea. The latter could be attributed to differences in habitat
selection between small (<100 mm) and large individuals (>100 mm)
and respective differences in the length frequency distributions
between the two areas (Fig. 1). In the winter, when sardine
reproduction takes place in Hellenic waters, it was positively
associated to areas of high productivity, in both regions.
Fig. 1. Length frequency distribution of sardine (A) in July 1998 and (B)
in June 1999.
References
1-Stergiou K.I., Christou E.D., Georgopoulos D., Zenetos A., and
Souvermezoglou C., 1997. The Hellenic Seas: Physics, chemistry, biology
and fisheries. Oceanogr. Mar. Biol. Ann. Rev., 35: 415-538.
2-Freon P., Misund O.A., 1999. Dynamics of Pelagic Fish Distribution
and Behaviour: Effects on Fisheries and Stock Assessment. Fishing New
Books, Oxford.
3-Masse J., 1996. Acoustic observations in the Bay of Biscay: Schooling,
vertical distribution, species assemblages and behaviour.öSci. Mar. 60,
Suppl.2: 227-234.
4-Rossi R.E., Mulla D.J., Journel A.G., Franz E.H., 1992. Geostatistical
tools for modelling and interpreting ecological spatial dependence. Ecol.
Monogr., 62(2): 277-314.
5-Swain D.P., and Kramer D.L., 1995. Annual variation in temperature
selection by Atlantic cod Gadusmorhuain the southern Gulf of St.
Lawrence, Canada, and its relation to population size. Mar. Ecol. Prog
Ser., 116: 11-23.
6-Barange M., and Hampton I., 1997. Spatial structure of co-occurring
anchovy and sardine populations from acoustic data: implications for
survey design. Fish. Oceanogr., 6(2): 94-108.
Table 1. Indices of parameter selection by sardine. S: index of parame-
ter selection; D: test statistic; p-value: probability of statistical signifi-
cance of parameter selection based on randomization test. NS=Non sig-
nificant.