SPATIOTEMPORAL DISTRIBUTION OF HAKE(MERLUCCIUS MERLUCCIUS)
IN THE N. AEGEAN SEA USING GEOSTATISTICAL ANALYSIS
S. Kavadas
1 *
, A. Siapatis
1
, A. Kalianiotis
2
, C. Papaconstantinou
1
1
National Centre for Marine Research, Athens, Greece - * stefanos@ncmr.gr
2
Fisheries Research Institute, Kavala, Greece
Abstract
Geostatistical techniques were used to analyze the spatio-temporal distribution of hake in the N. Aegean Sea during 1996 to 2000, based
on five experimental trawl surveys. Abundance varied significantly both spatially and temporally. Spatial heterogeneity was attributed to
the biology of the species, the geomorphology and the environmental conditions prevailing in the study area.
Keywords: Geostatistics, spatial distribution, hake, North Aegean
Rapp. Comm. int. Mer M�dit., 37,2004
379
Introduction
Demersal fish assemblages have been analyzed using conventional
statistics, which are based on random, independent variables that
assume zero continuity and allow no extension of each data value.
This makes impossible to estimate points on a map, within an area as
all of these points should be given the same overall mean value.
Geostatistics (1, 2), assuming that adjoining points are correlated to
each other spatially, is used in earth sciences to analyse, model,
estimate and map the spatial distribution of natural resources through
the analysis of their spatial autocorrelation (3).
In the present study an attempt was made to map the spatial and
temporal distribution of hake abundance and to study the structure of
the hake population in the North Aegean using geostatistics and based
on five MEDITS surveys carried out during 1996-2000.
Material and methods
Surveys were carried out with a commercial trawler following
MEDITS methodology. A stratified sampling scheme with simple
random sampling within each stratum was used. The stratification
criterion was depth: 10-50, 50-100, 100-200, 200-500 and 500-800 m.
The sampling area was divided into six subareas (Fig. 1). Extended,
narrow continental shelves, basins, peninsulas, river runoff and
islands characterize this area. The sampling grid covered 63 stations
per survey.
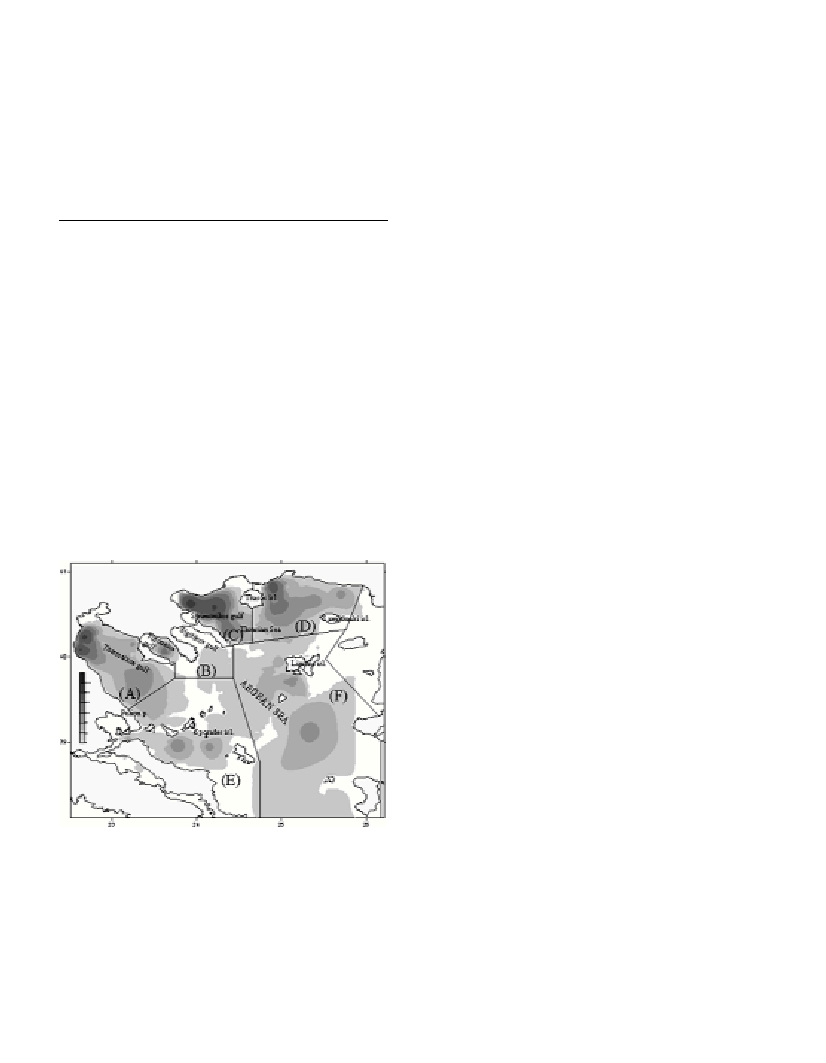
Fig. 1. Spatial distribution of hake in the N. Aegean Sea in 1999.
A geostatistical model was built to analyze hake abundance
(N/km
2
). We applied the spherical model that was adapted
significantly to the form of the experimental semivariograms (1, 2) of
our data. Point kriging was used to estimate the values of the sampling
points over a polygon defined by depth contours (10-800 m).
Results and discussion
The results showed that the spatial distribution of hake in the North
Aegean Sea extends to depths from 30 to 680 m.
The lowest values of hake abundance among the five surveys were
observed in 1996. In this year, the highest values of hake were
recorded at the subarea D (SE of Thasos Island) and at the subarea A
(across the Pelion peninsula). At the 1997 survey the highest values of
hake abundance were recorded at the subareas A (near the Aliakmonas
river outfall), C (inner and outer part of the Strimonikos Gulf) and F
(SW of Limnos island). During the 1998 survey the highest values
were recorded in subareas D (SE of Thasos island), C (outer part of
Strimonikos Gulf), E (southern part of Sporades islands) and B
(Toronaios Gulf). In 1999 survey, the highest values of hake
abundance were observed among the five surveys (Fig. 1). The highest
values were recorded in subareas C (inner and outer part of the
Strimonikos Gulf), D (near the Nestos river outfall), A (near the
Aliakmonas river outfall) and B (Toronaios Gulf). Finally in 2000
survey the highest values of hake abundance were recorded in
subareas A (near the Aliakmonas river outfall), D (between Thassos
and Samothraki islands), B (Toronaios Gulf) and F (with 3 different
peaks).
The North Aegean Sea is one of the most productive areas of hake
fishery in Greece (4). Significant differences of the spatial and
temporal patches of the population were detected during the five
surveys. In particular, areas near estuaries (i.e., west Thermaikos,
Strimonikos Gulf, NE of Thasos island) were characterised by the
highest values of hake abundance especially during 1999 and 2000.
The study of the length frequency distribution of hake indicated that
these areas are characterized by the presence of high densities of
juveniles. The heavy rainfalls during 1999-2000 can probably explain
the high concentrations of juveniles at these locations. Toronaios Gulf
was characterized by a presence of juveniles during all surveys.
Although the west part of Thermaikos Gulf and Toronaios Gulf are
generally considered as nursery grounds (5), our results showed that
Strimonikos Gulf and the area NE of Thasos are characterized by the
highest density of juveniles.
References
1-Matheron, G., 1971. The theory of regionalized variables and its
applications. Cah. Center Morphol. Math. Fontainebleau,5.
2-Journel, A.G., and Huijbrgets, C.J., 1978. Mining geostatistics.
Academic.
3-Maynou, F., Conan, G.Y., Cartes, J.E., Company J.B., and Sarda, F.,
1996. Spatial structure and seasonality of decapod crustacean populations
on the northwestern Mediterranean slope. Limnol. Oceanogr.,41(1): 113-
125.
4-Stergiou, K.I., 1989. Multivariate analysis and trends of the Greek
fishery. FISHBYTE, 7(2): 4-7.
5-Papaconstantinou, C., 1993. Factors affecting the distribution of the
nurseries ground of hake in the Greek seas E.30 (in abstract). Fisheries
Society of the British Isles. Congress on factors affecting the distribution
of fish. Conway, Wales. J. Fish. Biol. Suppl. A, 333 p.