LONG-TERM CHANGES IN PHYTOPLANKTON COMMUNITY STRUCTURE
FROM 1989 TO 2002, ADRIATIC SEA
Patricija Mozetic* and Janja France
National Institute of Biology, Marine Biology Station, Piran, Slovenia - * mozetic@mbss.org
Abstract
Phytoplankton abundance was followed from 1989 to 2002 in a shallow coastal area (Adriatic Sea) and the multivariate method STATIS
was used to detect any annual pattern common to 14 years. The results indicated a uniform annual distribution of phytoplankton with inter-
annual changes of particular groups. Diatoms and nano?agellates, which generally account for the majority of total abundance, had a very
constant distribution through the years but they peaked in different seasons. Other groups were characterised by larger inter-annual
changes, although their abundance was too low to affect significantly the general dynamic.
Key words: phytoplankton, long-term study, Adriatic
Rapp. Comm. int. Mer Médit., 37,2004
405
Introduction
Important information on the functioning of marine pelagic ecosys-
tems comes from planktonic long-term studies. This knowledge is
even more valuable in sensitive coastal areas and estuaries (in 1),
including Adriatic Sea and its northernmost basin – the Gulf of Trieste
(2, 3), where physical and biochemical processes are mainly driven by
freshwater ?ows and nutrient loading. This work comprises a 14-year
long time-series of phytoplankton abundance and community struc-
ture of the Gulf of Trieste. Phytoplankton dynamic was followed dur-
ing routine monitoring from 1989 to 2002. Since the number of sam-
ples was not the same each year the multivariate method STATIS (4)
was used to compare changes between years instead of time-series
analysis. With this approach we tried to detect any annual pattern
common to 14 years and to determine whether this pattern is stable
over time or not.
Material and methods
Seawater samples for phytoplankton analysis were taken almost
monthly from 1989 to 2002 on one station (21 m deep) in the Gulf of
Trieste. Only data of surface layer were considered. Organisms
belonging to diatoms, dino?agellates, coccolithophorids, silico?agel-
lates and one non-taxonomic group (nano?agellates) were counted on
an inverted microscope (5). The results of STATIS analysis are based
on a total of 160 samples.
Results and discussion
Simple time-series distribution of total abundance’medians sug-
gested moderate differences among the years while the size of the
boxes and extend of the maximum values pointed out the years with
large blooms (Fig. 1). Instead, the STATIS inter-structure analysis
revealed a uniform distribution of phytoplankton abundance over the
14 years on the first axis (data not shown). Since this axis explains 91
% of the total inertia, these results indicated a strong common annual
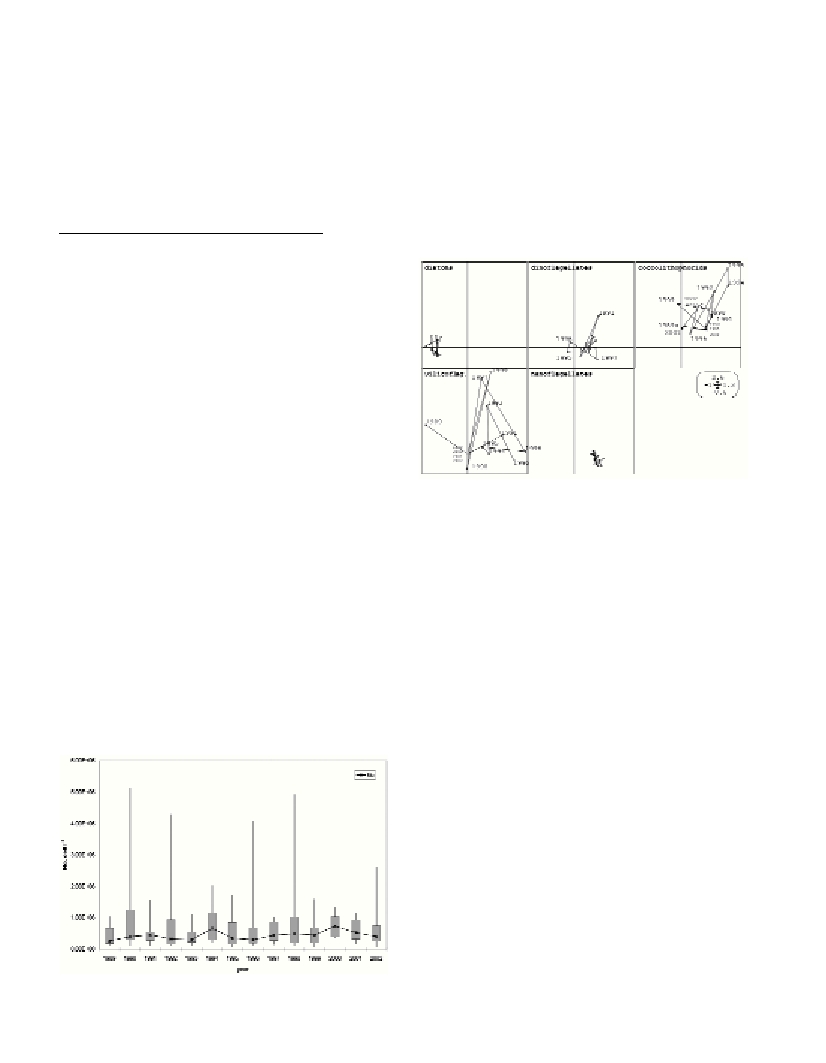
pattern. The intra-structure analysis - the trajectories, showed changes
of the phytoplankton groups through the study period (Fig. 2).
Grouping of diatoms and nano?agellates on the opposite sides along
the first axis indicated a very constant distribution, though with differ-
ent seasonal characteristics of both groups. Nano?agellates had one
distinctive and long period of predominance in spring, while diatoms
abrupt significantly in autumn and July. The usual early-spring peak
was apparently not constant enough in time to be identified as a bari-
center by the STATIS analysis. Dino?agellates and coccolithophorids
were, on the contrary, characterised by larger inter-annual changes.
These changes were due to different occurrence of seasonal blooms or
to their absence. Although the trajectory of silico?agellates appeared
the most variable among all groups, this is likely due to the combina-
tion of very irregular occurrence through the year and low abundance
rather than inter-annual variations.
The present study revealed a uniform distribution of phytoplankton
with inter-annual changes of particular groups, which, however, did
not expose any single year. This would suggest that physical-chemi-
cal properties of the Gulf remained relatively stable or they did not
affect the structure on the group level. Nevertheless, this necessitates
for additional analysis on species level, which would probably point
out seasonal variations or shift in dominating species and help to
explain changes in trophic structure observed in last decades.
References
1-Harding L.W. Jr., and Perry E.S., 1997. Long-term increase of
phytoplankton biomass in Chesapeake Bay, 1950-1994. Mar. Ecol. Prog.
Ser., 157: 39-52.
2-Cataletto B., Feoli E., Fonda Umani S., and Chen Yong S., 1995.
Eleven years netzooplankton community in the Gulf of Trieste: time series
analysis. ICES J. Mar. Sci., 52: 669 - 678.
3-Mozetic P., Fonda Umani S., Cataletto B., and Malej A., 1998.
Seasonal and inter-annual plankton variability in the Gulf of Trieste
(northern Adriatic). ICES J. Mar. Sci., 55: 711-722.
4-Lavit C., Escoufier Y., Sabatier R., and Traissac P., 1994. Tha ACT
(STATIS method). Comput. Stat. Data Anal., 18: 97-119.
5-Utermöhl H., 1958. Zur Vervollkommnung der quantitativen
Phytoplankton Methodik. Mitt. int. Ver. Theor. angew. Limnol., 9: 1-38.
Fig. 1. Medians, quartiles (boxes) and minimal and maximal values
(low-high lines) of total phytoplankton abundance, 1989-2002.
Fig. 2. Trajectories of phytoplankton groups derived from the STATIS
intra-structure analysis, 1989-2002.