CHARACTERISTICS OF THE GROWTH OF THE ANCHOVY ENGRAULIS ENCRASICOLIS
DURING A COMPLETE LIFE CYCLE
Sami Souissi
Station Marine, Université des Sciences et Technologies de Lille, CNRS-UMR 8013 ELICO, Wimereux, France
Sami.Souissi@univ-lille1.fr
Abstract
This paper presents the general form of the growth curve in length as a function of age of the anchovy Engraulis encrasicolus. This study
is a compilation of several data from the literature concerning the life cycle from yolk-sac larvae to adults. Numerical tools were used to
fit such heterogeneous data set and to assess the growth rate.
Keywords: Life cycle, growth, anchovy
Rapp. Comm. int. Mer Médit., 37,2004
445
Introduction
The biology of the anchovy E.encrasicolishas been studied to
understand the role of this short living species (4-5 years) in the
western Mediterranean ecosystems and to improve its management
[1,2]. To improve management of these stocks, the life cycle strategy
of E. encrasicolusshould be better understood [2]. In the NW
Mediterranean the spawning areas are localised in the most productive
planktonic zones [1]. The demographic and growth processes during
the early life stages are crucial for recruitment. However, only few
studies have examined the demographic and growth processes of
fishes during their ontogeny. The aim of this paper is to present the
growth curve in length as a function of age from yolk-sac larvae to the
last adult age-class. This analysis is a first step necessary before
building complete life cycle models including demography and
growth processes.
Methods
The age/length tables for larval, post-larval, pre-adults and adult
phases were obtained from several studies realised in the Adriatic, the
western Mediterranean and also in the Bay of Biscay [2]. Larvae were
aged by means of daily growth increments in the otoliths. By putting
all data of adults together a precision of 6 months was obtained. Most
standard techniques of fitting empirical models cannot be used for
such heterogeneous data. We used an alternative technique based on
spline functions in order to fit the complete growth function. This
procedure developed under Matlab Software is very ?exible and may
allow obtaining either integration or derivative of the obtained
function [3].
Results and discussion
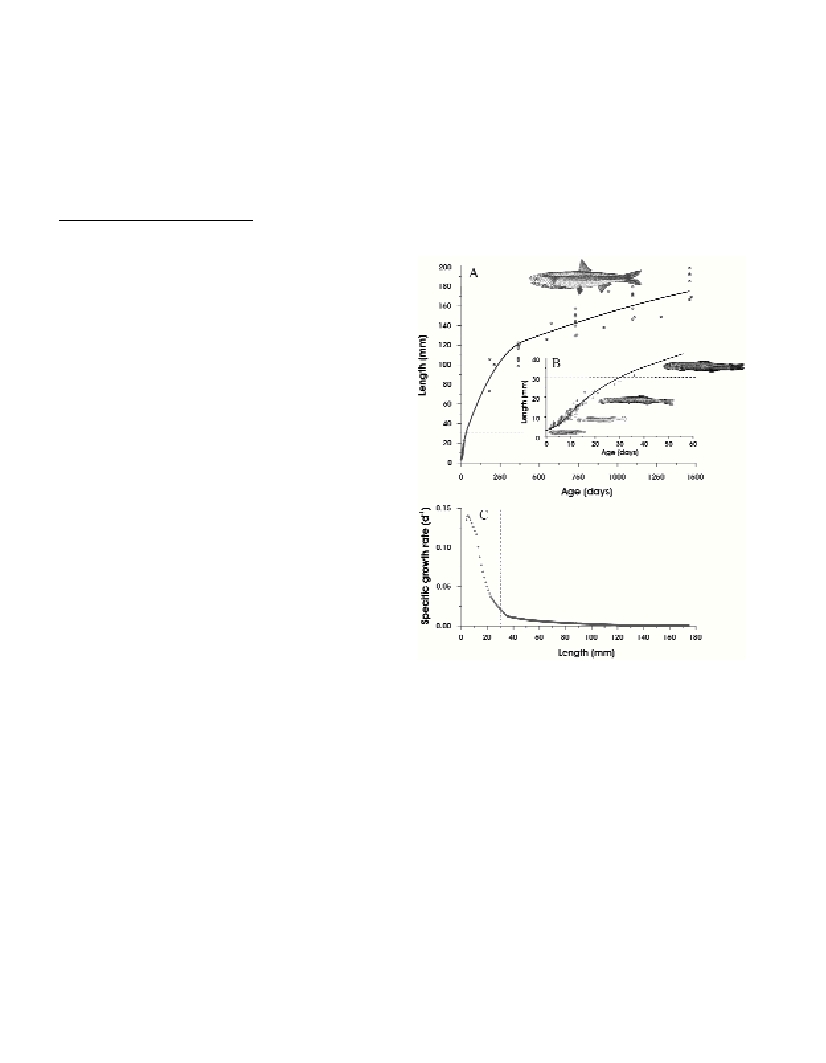
Figure 1A shows the shape of the growth curve of E. encrasicolus
from larvae (<4 mm) to last age-class (170-200 mm). The length of
metamorphosis (30 mm) is reached rapidly after one month. The
general pattern of the variation of the specific growth rate as a
function of length shows a like-hyperbolic curve (Figure 1C). This
strategy of high growth rate during the first year and a first maturity
around 110 mm may be explained by the high mortality encountered
during this phase. The absence of clear relationship between stock and
recruitment of these clupeid species is another reason for focusing on
the complete life cycle processes. For a congeneric species E. mordax,
Peterman et al.[4] used 13-year data of abundances of the first three
stages: eggs, larvae (4-5 days) and early juveniles (19 days). They
argued that the absence of correlations between these abundances and
the number of recruits (1 year) was related to high variability
(CV=171%) of the survival rate between 19 days and one year.
The results showed here represent a first step towards modelling of
the growth rate of anchovy during the complete life cycle. To explain
variability in the data, a bioenergetic model including the effects of
environmental factors should be developed. Such a model may allow
possible interactions between the environment, the recruitment and
population dynamics to be better assessed.
References
1-García A., and Palomera I., 1996. Anchovy early life history and its
relation to its surrounding environment in the Western Mediterranean
Basin.Sci. Mar., 60:155-166.
2-Souissi S., 1998. Modélisation du cycle de vie d’un poisson:
Conséquences pour la gestion des ressources exploitées. Application ŕ
l’étude de l’interaction entre les populations de copépodes et la population
d’anchois. Thčse de doctorat, Université Pierre et Marie Curie, Paris VI.,
416 p. (+annexes, 187 p.).
3-Bernard O., and Souissi S., 1998. Qualitative behavior of stage-
structured populations: application to structural validation.J. Math. Biol.,
37:291-308.
4-Peterman R.M., Bradford M.J., Lo N.C.H., and Methot R.D., 1988.
Contribution of early life stages to interannual variability in recruitment of
northern anchovy (Engraulis mordax). Can. J. Fish. Aquat. Sci., 45: 8-16.
Fig. 1. A) Growth function of the anchovy E. encrasicolusduring the com-
plete life cycle. Symbols correspond to a compilation of the data from the
literature [2]. Solid line is obtained by using the stepwise method of fitting
based on spline functions. B) A zoom for the growth function during the
first two months. C) Variation of the specific growth rate (d
-1
) as a function
of length of individuals. Discontinuous lines in all panels show the length of
metamorphosis of this species.