ZOOPLANKTON COMMUNITY STRUCTURE AND DISTRIBUTION IN THE BAY OF
VILLEFRANCHE-SUR-MER USING THE ZOOSCAN DIGITAL IMAGING SYSTEM
Caroline Warembourg*, Lars Stemmann, Stéphane Gasparini, Laure Mousseau, Frédéric Ibanez, Gabriel Gorsky
Observatoire Océanologique, LOV - UMR 7093, Station Zoologique, Villefranche-sur-Mer, France
* waremb@obs-vlfr.fr, stemmann@obs-vlfr.fr, gasparini@obs-vlfr.fr, mousseau@obs-vlfr.fr, ibanez@obs-vlfr.fr, gorsky@obs-vlfr.fr
Abstract
The mesozooplankton (>200 µm) abundances and biomass spectra were studied in a 8-years time-series in the coastal zone of the North
Ligurian Sea using a new image analysis system. Preliminary results show a clear seasonal cycle of both abundance and biomass structure
of the zooplankton community. These are related to changes in zooplankton biodiversity and phytoplankton biomass.
Keywords : zooplankton, biomass spectrum, image analysis
Rapp. Comm. int. Mer Médit., 37,2004
460
Zooplankton plays a central role in aquatic ecosystems relative to
phytoplankton and higher trophic levels (1). It is a biological indicator
of environmental changes (2) or human impacts on marine systems.
Within the french program SOMLIT, we have followed the temporal
variability of coastal mesozooplankton with environmental changes in
a 8-years time-series. Weekly samples of zooplankton collected by a
WPII net (200 µm of mesh size) between 1995 and 2003 in the bay of
Villefranche-sur-Mer (North-western Mediterranean) were analysed
by the ZOOSCAN. This new system is a low-cost imaging device
which allows rapid, exhaustive and non-destructive enumeration and
measurements of mesozooplankton and micronekton (3). It permits to
describe the biodiversity and size of the zooplankton community by
measuring 38 morphometric attributes for each individualwith an
automated identification. In our study, slopes of the biomass spectra
(4) are calculated for the mesozooplankton community (450 to
1550µm in Equivalent Spherical Diameter) on 273 samples (more
than 300 000 individuals measured).
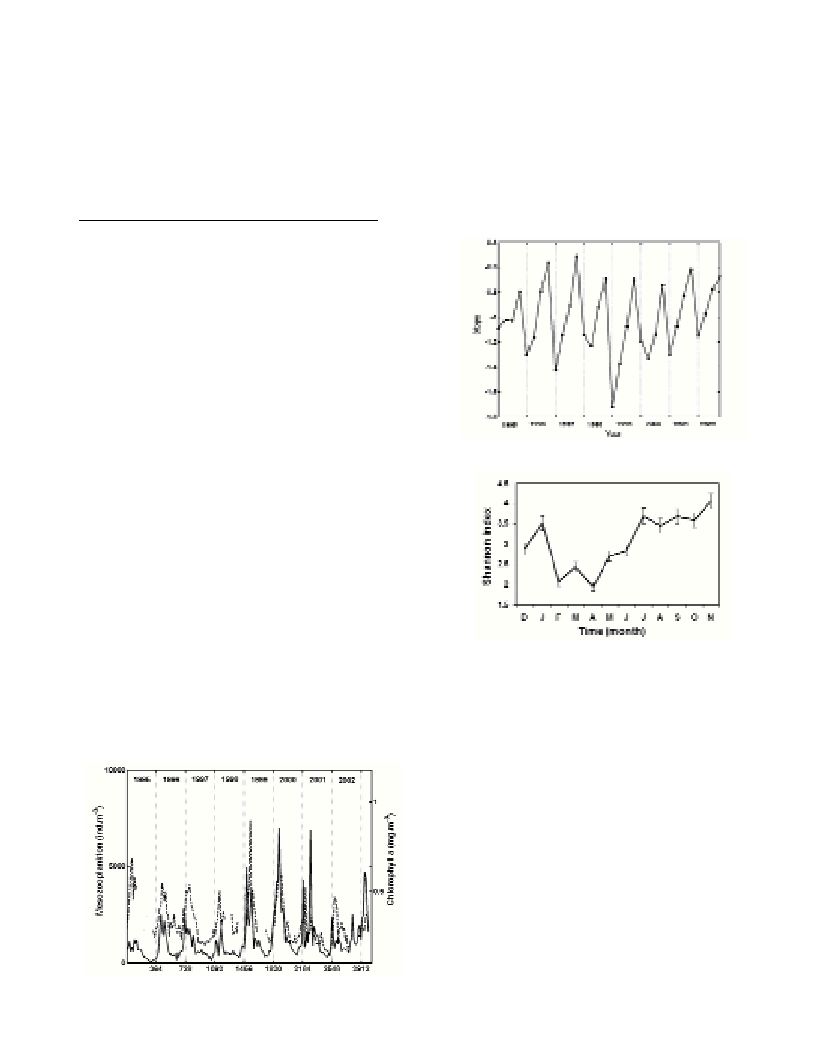
The zooplankton abundance shows a seasonal cycle over the eight
years (Fig. 1). Abundances are higher in winter-spring period (500-
7000 ind.m
-3
) than during the summer-autumn period (35-2500
ind.m
-3
). The results show a high inter-annual variability with the
highest abundances between 1999 and 2001. The zooplankton
seasonal cycle generally follows the chlorophyll acycle. The slope of
the biomass spectrum provides an informative measure of the
structure of the plankton community. The temporal distribution of the
calculated slopes (Fig. 2) also exhibits a seasonal pattern : 1) a steep
spectrum characterized by a high negative slope (in winter and spring)
indicates the dominance of organisms with a low biomass, 2) a ?at
spectrum with a less negative slope (in summer and fall) implies a
higher proportion of larger organisms. During the year 2002, the
Shannon diversity index (calculated only on the abundance of
copepods manually identificated) shows that copepods’biodiversity
was lower in winter-spring during the phytoplankton bloom than
during the rest of the year (Fig. 3). This suggests a relationship
between the biomass structure and the biodiversity. In November
2002, the spatial structure of the zooplankton community was also
analysed on a transect from the South French coast to the central
Ligurian Sea. The slopes of the biomass spectra are steeper in the
open sea than in the coastal area. At that time of the year, chlorophyll
aconcentrations are higher in the open sea as a result of well
established upwelling (5).
These preliminary results obtained by the ZOOSCAN reveal some
temporal and spatial patterns of the zooplankton community structure
which can be associated with changes in zooplankton diversity and
phytoplankton biomass. The next step will be the taxonomic
identification of all organisms by the ZOOSCAN, in order (1) to
evaluate the link between biodiversity and biomass spectra, (2) to
describe the relationship between zooplankton (biodiversity and
biomass) and environmental factors (phytoplankton, nutrients, detritic
particles, temperature, salinity).
References
1-Banse K., 1995. Zooplankton: pivotal role in the control of ocean
production. ICES J. Mar. Sci., 52: 265-277.
2-Beaugrand G., Reid P.C., Ibanez F., Lindley J.A., and Edwards M.,
2002. Reorganization of North Atlantic marine copepod biodiversity and
climate. Science, 296: 1692-1194.
3-Grosjean P., Picheral M., Warembourg C., and Gorsky G., accepted.
Enumeration, measurement and identification of net zooplankton samples
using the ZOOSCAN digital imaging system. ICES J. Mar. Sci.
4-Platt T., and Denman K., 1977. Organization in the pelagic ecosystem.
Helgol. Meeresunters., 30: 575-581.
5-Sournia A., Brylinski J.-M., Dallot S., Le Corre P., Leveau M., Prieur
L., and Froget C., 1990. Fronts hydrologiques au large des côtes
françaises: Les sites ateliers du programme Frontal. Oceanol. Acta.,
13(4): 413-438.
Fig. 1. Temporal distributions of the biweekly mesozooplankton abun-
dance (continuous line) and chlorophyll a(dashed line).
Fig. 2. Temporal distribution of biomass spectra slope from 1995-2002.
Fig. 3. Monthly variation of the copepods Shannon index during the year
2002.