FIRST ASSESSMENT OF THE NATURAL STOCK OF MICROCOSMUS SABATIERI
IN SOUTH AEGEAN (GREECE)
Antoniadou C.
1
, Chintiroglou C.C.
1 *
, Voultsiadou E.
1
and Vafidis D.
2
1
Aristotle University, School of Biology, Department of Zoology, Thessaloniki, Greece - * chintigl@bio.auth.gr
2
Fisheries Research Institute of Kavala, Nea Peramos, Kavala, Greece
Abstract
The spatial variation in population density and frequency distribution of the edible tunicate Microcosmus sabatieriwas studied in South
Aegean. Data was obtained with randomly placed frames. Overall, 316 specimens were collected and measured. Mean population density
was 7 ±1.87 indiv./m
2
, while the pattern of dispersion was even. The size-frequency analysis indicated a mode at 10 cm.
Rapp. Comm. int. Mer Médit., 37,2004
477
Introduction
The continuous decrease of fish stocks has a severe economic
impact on fisher’s livelihood throughout the Mediterranean. Therefore
a necessity emerges to turn from traditional fisheries resources to
other alternatives (1). Microcosmus sabatieriRoule, 1885 is a
Mediterranean endemic species, previously reported from the Aegean
Sea (2). It is edible and of commercial interest in many Mediterranean
areas (3). However, there is no data on its population structure.
This study present preliminary data on the status of M. sabatieri
stocksin South Aegean, an area where it is strongly harvested.
Materials and Methods
Samples were collected with SCUBA diving at 3 sites
(A:36
o
30’459’’N 26
o
19’859’’E; B: 36
o
34’498’’N 26
o
15’287’’E;
C:36
o
31’733’’N 26
o
28’317’’E) along the coastline of Astypalaia, at a
depth ranging from 30 to 55 m, in August 2003. The method of
randomly placed frames (0.5 x 0.5 m) was applied to estimate
population density and spatial dispersion, since Microcosmus
sabatieriis an epibenthic and sessile species, thus permitting in–situ
counting (4). In addition, all individuals found in a 30-min dive were
collected and preserved in a 10% formalin solution.
Length-frequency distributions were constructed per site.
Morisita’s index was calculated at site B to estimate spatial dispersion.
A chi-square test was used to determine the significance of deviation
from random distribution (4).
Results and Discussion
Overall, 316 individuals of Microcosmus sabatieriwere collected
and measured. The mean population density from the three sampling
sites was 7 ±1.87 indiv./m
2
. The lowest value (4 ±1.17 indiv./m
2
) was
recorded at site A, the largest one (10 ±2.1 indiv./m
2
) at site B,
whereas it was intermediate (6 ±1.48 indiv./m
2
) at site C. The pattern
of dispersion was even (I = 1.15, x
2
= 7.2), which agrees with the
territoriality behaviour of this solitary species (4).
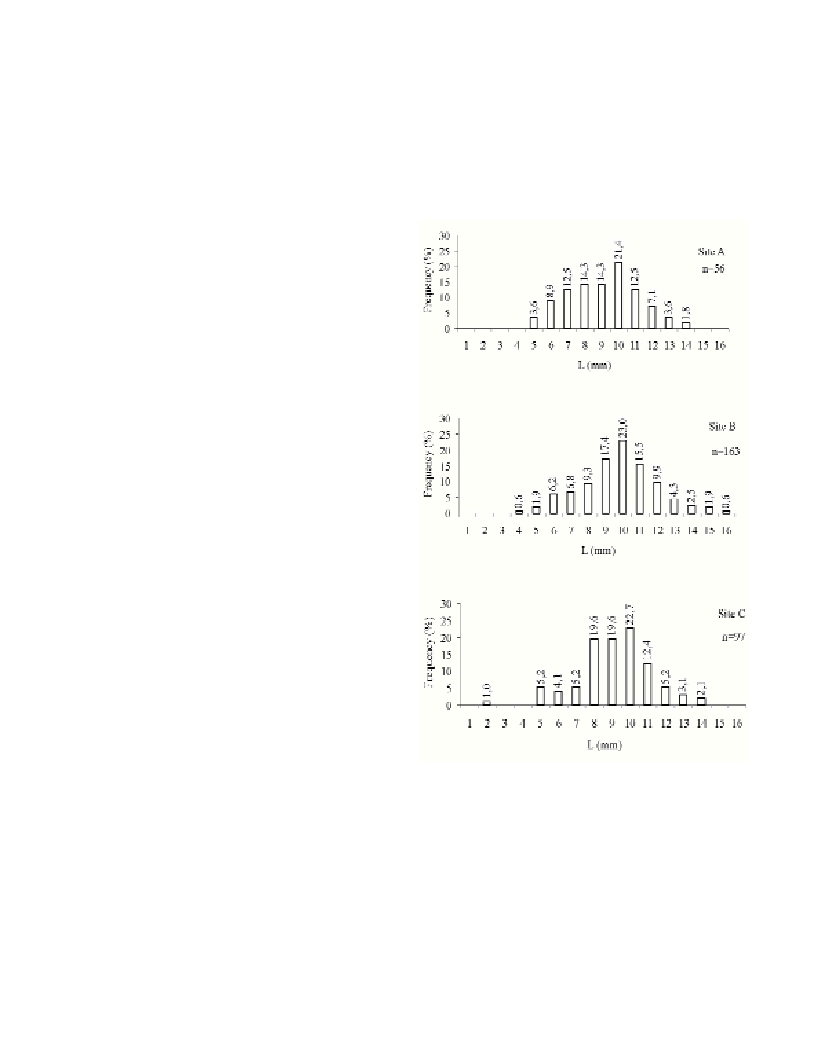
The size-frequency histograms revealed a similar pattern among the
three sites with a mode at 10 cm (Fig. 1). Size ranged from 2 to 16 cm,
with the largest individuals caught at site B and the smallest ones at
site C. The maximum length reported for the Mediterranean Sea is 22
cm (3), which is larger than the ones reported here (Fig. 1), a fact that
might be the result of a strong fishing pressure.
References
1-Pauly D., Christensen V., Guenette S., Pitcher T.J., Sumaila U.R.,
Walters C.J., Watson R., and Zeller D., 2002. Towards sustainability in
world fisheries. Nature, 418: 689-695.
2-Koukouras A., Voultsiadou-Koukoura E., Kevrekidis T., and Vafidis D.,
1995. Ascidian fauna of the Aegean sea with a checklist of the Eastern
Mediterranean and Black Sea species. Ann. Inst. Ocean. Paris, 71(1):
19-34.
3-Monniot C., and Monniot F., 1987. Ascidies (Ciones at Violet). Pp. 1-
743-760. In: Fiches FAO d’identification des espèces pour les besoins de
la pêche (révision I) – Méditerranée et mer Noire. Zone de pêche 37.
Volume I. Eds Fischer W, Bouchon M.L. & Scneider M. Rome.
4-Antoniadou C., 2003. Structure of hard substrate benthic assemblages
at the lower infralittoral zone in the North Aegean Sea. Thesis, Aristotle
University, Thessaloniki, Greece. Pp. 1-446.
Fig.1. Size-frequency distribution for Microcosmus sabatieri at different
sites. n = number of individuals.