ANNUAL VARIABILITY IN THE DISTRIBUTION OF SURFACE NUTRIENTS
AND PHYTOPLANKTON IN THE OMBLA RIVER ESTUARY
Marina Caric * and Nenad Jasprica
Institute of Oceanography and Fisheries, Dubrovnik, Croatia - * caric@labdu.izor.hr
Abstract
Karstic fresh waters enrich the Ombla River estuary with nutrients, especially with NO
3
, PO
4
and SiO
4
. The concentration of all nutrients
decreased from the upper to the lower reaches of the estuary. Peaks of phytoplankton occurred in May and August. The phytoplankton
abundance, as with nutrients, decreased towards the lower reaches of the estuary.
Key words: hydrography, nutrients, phytoplankton, estuary, Adriatic Sea
Rapp. Comm. int. Mer Médit., 37,2004
500
Introduction
The highly stratified and low tidal, 4 km long estuary of the Ombla
River is located on the Adriatic coast near Dubrovnik. Theregion is
influenced by karstic fresh and marine waters. This paper aims at
determining the annual variability in the distribution of surface
nutrients and phytoplankton abundance along the longitudinal axis of
the Ombla river estuary.
Results and Discussion
Samples for the analysis of hydrographic, chemical and biological
parameters were collected at three stations (Ombla-1, 6 m deep;
Ombla-2, 15 m; Ombla-3, 25 m) along the estuary, during 17 cruises
from November 1999 to November 2000. Parameters were
determined by standard oceanographic methods (1, 2).
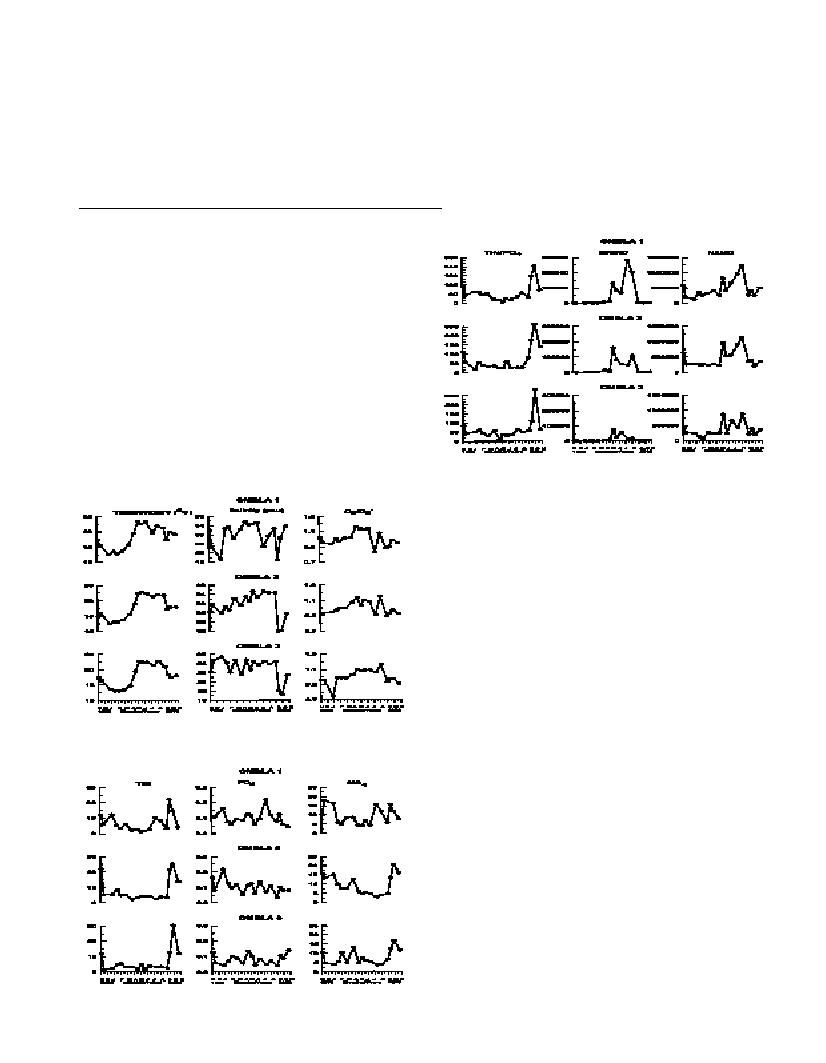
Annual variations in the mean values of investigated physico-
chemical parameters as well as phytoplankton abundance are
presented in Figures 1, 2 and 3.
Temperatures rose from March to end-May and were more or less
constant until September. In October, the water column began to cool.
The minimal salinity value was 17.94 psu, indicating a noticeable
influx of seawater throughout the entire estuary. The oxygen
saturation indicated a good aeration.
The concentration of all nutrients decreased throughout the estuary
for most of the year. The Redfield ratio (TIN/ PO
4
) values were
appropriate for phytoplankton growth from April to August, and
means were as follows: 27 (Ombla-1), 31 (Ombla-2), 38 (Ombla-3).
The Redfield ratio increased throughout the estuary, as compared to
nutrients.
The first peaks of microphytoplankton (cells longer than 20 µm,
MICRO), and nanophytoplankton (cells 2-20 µm, NANO), occurred
during end-May. This was a time when temperatures reached their
high rising value, 22.45
0
C. The PO
4
concentrations were higher than
0.1 mmol dm
-3
, and the Redfield ratio values were 14 (Ombla-1),
19(Ombla-2) and 34 (Ombla-3). The MICRO population was
composed of dinoflagellates (>89%), mostly Prorocentrum
triestinum. Second peaks of MICRO and NANO appeared at end-
August. The concentration of all nutrients at the Ombla-1 station was
high: TIN-10.27, PO
4
-0.22, SiO
4
-15.91,decreasing towards the lower
reaches of the estuary. At Ombla-3 station, it was: TIN-3.55,
PO
4
0.07, SiO
4
-4.12 (mmol dm
-3
). The Redfield ratio values were 34,
37 and 39. The MICRO population (>85%) was made up of the
dinoflagellates, mostly Scrippsiella trochoidea.
It is generally assumed that, in estuaries, primary production
decreases in the landward direction (3). In the Ombla River estuary
the phytoplankton population density decreased towards the lower
reaches of the estuary. Aprobable reason could be the decrease of
nutrients and the increase of the Redfield ratio.
References
1-Strickland J.D.H. and Parsons T.R., 1972. Apractical handbook of
seawater analysis. Bull. Fish. Res. Bd. Can., 167, 310p.
2-Utermöhl, H., 1958. Zur Vervollkommnung der quantitativen
Phytoplankton Methodik. Mitt. int. Ver. Theor. Angew. Limnol. 9: 1-38.
3-Heip, C.H.R., Goosen, N. K., Herman, P. M. J., Kromkamp, J.,
Middelburg, J. J., Soetaert, K. 1995. Production and consumption of
biological particles in temperate tidal estuaries.Oceanography and
Marine Biology Annual Review33: 1-149.
Fig. 1. Annual distribution of temperature, salinity and oxygen saturation
(average).
Fig. 3. Annual distribution of Redfield ratio, microphytoplankton and
nanophytoplankton abundance (cells/L), (average).
Fig. 2. Annual distribution of nutrients (average, mmol dm
-3
).