Rapp. Comm. int. Mer Médit., 36,2001
51
Introduction
TheH
AMSON
is a three dimensional and finite difference ocean circula-
tion model developed by the IFM (Institute fur Meereskunde, Hamburg)
and Puertos del Estado (1, 2, 3). It can take into account the tides, wind,
atmospheric pressure, heat ?uxes and baroclinic gradients inside the ocean.
It has been applied to a large variety of scales and phenomena.
On the other hand Puertos del Estado is responsible for a permanent tide
gauges network (R
E
D
M
A
R
) (http://www.
p u
e r
t
o
s .
e
s
/
M
a
r
e
a
s
/
i
n
d
ex
.
h
t
m
l
)
that consists of 14 acoustic sensors along the Spanish coast, most of them
in operation since mid 1992. Three of the stations are located at Western
Mediterranean harbours: Barcelona, Valencia and Málaga. The tide gauges
provide 5-min sea level data that are transmitted to the central station in
Puertos del Estado, where the data are quality controlled and analysed (4).
Description of the system
The Nivmar system consists of a set of different applications and pro-
grams that makes use of the barotropic and vertically integrated version of
theH
AMSON
model. The model domain covers an area extending from
20°N to 48°Nin latitude and from 34°W to 30°Ein longitude (all the
Western Mediterranean). The bathymetry employed, based on the DTM5
data set (4), was built by using a variable grid size scheme in order to
reduce the number of computational points. The region from 25°Nto 48°N
and from 20°Wto 30°Ekeeps a constant resolution of 10'x15'. The grid
size in the rest of the domain is increased progressively to the boundaries.
TheH
AMSON
is executed twice a day using the output from the INM
(Instituto Nacional de Meteorología) application of H
IRLAM
(5) to give the
meteorological sea levels with a forecast horizon of 48 hours. The meteo-
rological data consist of 6 hourly fields of pressures and winds at 10 m,
with 0.5°x0.5°resolution.
The ocean model run really covers a period spanning from 12 hours
before the starting time to 48 hours later. Data from R
EDMAR
tide gauges
are used, allowing the system to correct systematic errors in the mean sea
level due to physical processes that are not included in the ocean model (i.
e. steric height).
The tide predictions obtained from analysis of the tide gauge data are
added to the meteorological sea level component given by the H
AMSON
model in order to have a 48 hours forecast of the total sea level. Results
fromN
IVMAR
are placed on a massive storage system (Unitree) and dis-
tributed through the web (http://www.puertos.es/Nivmar).
Validation of the system
The Nivmar system was validated with data from the REDMAR tide
gauge network. A very stormy period was chosen for va l i
d
a
t
i
o
n
(November 1995 to March 1996), which is the PROMISE Spanish Coast
Data Set Period.
The mean value of the simulated series was modified to the value of the
measured one. These techniques are usually employed in hindcast studies
of surge simulations (6). Table 1 shows a statistical comparison between
simulated and measured series in different stations of the R
EDMAR
.
Validation of the system for other harbours in the Mediterranean sea was
proposed within MedGLOSS project and is under development.
Near real time verification
When predicting the sea level a problem is found to relate the "datum"
of the measured series and the one of the simulated series at a particular
station. The technique employed consists of matching the means of the last
measured data at the tide gauge and the mean of the prediction (7). In this
way the information provided by the tide gauge for the recent past is used
to improve the quality of the predictions, by incorporating the long-term
variability not reproduced by the model.
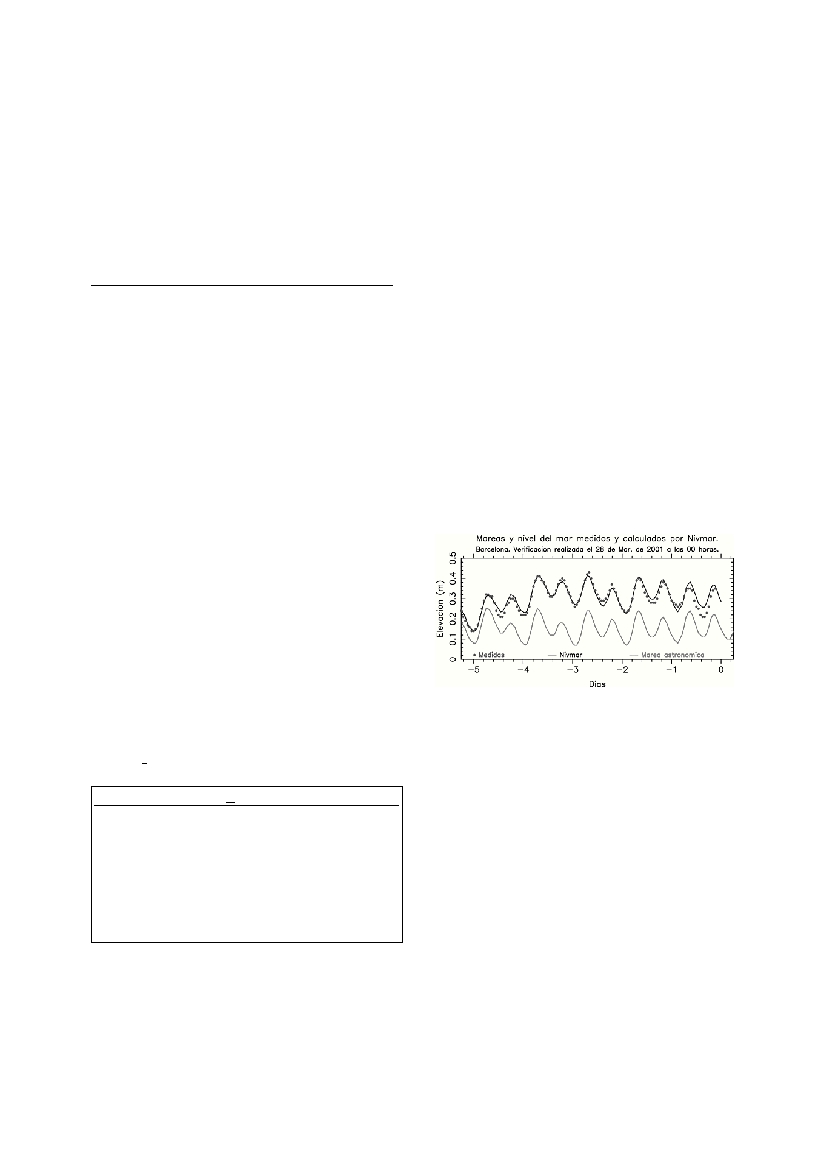
The use of the Nivmar system is particularly important in our
Mediterranean coast, due to the nearly negligible amplitude of the tide. For
the three stations located in this sea (Málaga, Valencia and Barcelona), this
simple scheme of assimilation is already working. In Figure 1 an example
of the near real time verification performed twice a day is shown for
Barcelona harbour.
References
1 - Rodríguez, I. and Álvarez E. (1991). Modelo Tridimensional de Corrientes.
Condiciones de aplicación a las costas espańolas y análisis de resultados para
el caso de un esquema de mallas anidadas. Clima Marítimo report n 42.
2 - Rodríguez, I., Álvarez E., Krohn J. and Backhaus J. (1991). A mid-scale
tidal analysis of waters around the north-western corner of the Iberian
Peninsula. Proceedings book from "Computer modelling in ocean engineering
91", Balkema.
3 - Backhaus, Jan O. (1985). AThree-Dimensional model for simulation of
shelf sea dynamics. Dt. Hydrogr.Z. 38, H.4: 164-187.
4 - Pérez B., Rodríguez I. (1999) REDMAR: Red de Mareógrafos de Puertos.
Informe anual 1998. CEDEX Technical Report for Puertos del Estado.
5 - GETECH (1995) Geophysical Exploration TECHnology internal report.
Department of Earth sciences. University of Leeds, UK.
6 - Kallen (1996) HIRLAM documentation manual, system 2.5
7 - Vested H. J., Nielsen J. W., Jensen H.R., Kristensen K.B. (1995). Skill
Assessment of an operational Hydrodynamic Forecast system for the North
Sea and Danish Belts. Quantitative skill assessment for coastal ocean models,
373-398AGU.
NIVMAR : A SPANISH STORM SURGE FORECAST SYSTEM
Enrique Álvarez, Begońa Pérez*, J. Damián López, Ignacio Rodríguez
Área de Conocimiento y Análisis del Medio Físico,Ente Público Puertos del Estado, Madrid, Spain - bego@puertos.es
Abstract
TheN
IVMAR
system was developed in 1998 by Puertos del Estado to provide sea level predictions for the Spanish harbours which includ-
ed also the meteorological forcing. This is particularly important for the Mediterranean coast, due to the small range of the tide. The sys-
tem is based on the operational running of an ocean circulation model (which performs the prediction of the meteorological residuals), and
the use of the tide gauge data both to obtain the astronomical prediction in the harbour and to validate the system. A description is made
of the model, data transmission and near real time verification, this one fundamental to correct and improve the quality of the predictions.
Examples of the good operation of the system in Mediterranean harbours are presented.
keywords: sea level, circulation models, western Mediterranean
Table 1: Statistical comparison of measured and simulated residuals.
Nr: number of records; X mean value of the measured residuals; rmse:
Root Mean Square Error; rmax: maximum error; m and b: slope and
interception of the linear fit and CI: Correlation Index.
EstaciónNrXrmsermaxmbCI
Bilbao36487.895.6621.030.821.440.90
Santander35719.305.7224.730.881.140.91
Gijón
3382-0.686.1319.700.88-0.080.89
La Coruńa364817.585.8920.690.813.300.92
Vigo
361415.235.0420.860.812.820.95
Bonanza348311.5910.1766.930.446.540.80
Málaga364811.635.1426.120.693.660.86
Valencia361211.845.7517.380.634.420.85
Barcelona363010.885.1420.040.713.150.89
Tenerife36109.204.2417.080.643.350.77
Las Palmas33926.733.7011.600.652.340.83
Figure 1: Example of the operation of the system in Barcelona.