Rapp. Comm. int. Mer Médit., 36,2001
57
Introduction
The data from the station situated at the entrance at the Kastela Bay have
a special meaning for studying the processes in the Bay, especially for
d
e
fining boundary conditions for the dynamic model initialisation.
Therefore, the Institute of Oceanography and Fisheries (IOF) maintains the
station, which worked since fifties. The data set became long enough
[1,2,3] for climatic variability studies, especially when assembled with
other data [4,3]. Long-term data set from the permanent station consists of
discrete measurements, acquired by classical met-ocean instrumentation.
Keeping up with G
OOS
(IOC-U
NESCO
’
S
program Global Ocean Observing
System) recommendation for automatic metocean measurements,
advanced measurements techniques and data transmission methods have
been introduced in addition to the classical metocean measurements.
Material and methods
Coastal oceanographic station Split Marjan-Cape established in 1946 in
front of the main building of the IOF at the entrance of the Kastela Bay,
works since 1950, as well as the classical tide-gauge Kepmen with 1:5
reduction. Sea temperature is measured at 0m and 2m, with classical ther-
mometer in the first two climatological terms: 7h and 14h local time.
Samples for the salinity determination are taken twice weekly.
Meteorological station, established in 1951 (fixed meteorological screen
and rain-gauge) is located 25m form the coast, at the 12m altitudes. The
thermograph (SIAP) measures continuously, while minimal, maximal and
actual temperatures are recorded at 7h (local time), as well as daily pre-
cipitation sum. Based on the General Purpose Data Acquisition System [5],
the real-time data transmission has been realized in March 1999 through
the Internet web page www.izor.hr [6], from the experimental automatic
metocean station (A
MOS
), which utilizes Aanderaa instruments sensors.
A
MOS
measures wind (direction, speed and gust), air and sea temperature,
humidity and pressure, precipitation, radiation (solar and net), salinity, and
sea level. For all the measured parameters monthly means and variances
were analysed. Because of the specific location relative to the coast, wind
speed and direction are not always representative for the larger area; the
winds from the southeast to northeast direction show considerably lower
speeds (relative to the first order meteo-station Split-Marjan). Sea temper-
ature and salinity were measured at 0.5m depth and are considered the sea
surface measurements, and other parameters were measured at 10m alti-
tude, acquired in ten minutes intervals, but hourly values were taken for
calculations.
Results and discussion
Based on the hourly values, daily means were calculated for all the mea-
sured parameters (Fig.1). There were some interruptions of measurements,
due to electricity breaks, or other malfunctions. In spite of occasional short
breaks and four breaks of measurements longer than a day, and malfunc-
tions of some sensors in some shorter intervals, the overall work of the
A
MOS
could be considered successful. The sea surface daily mean temper-
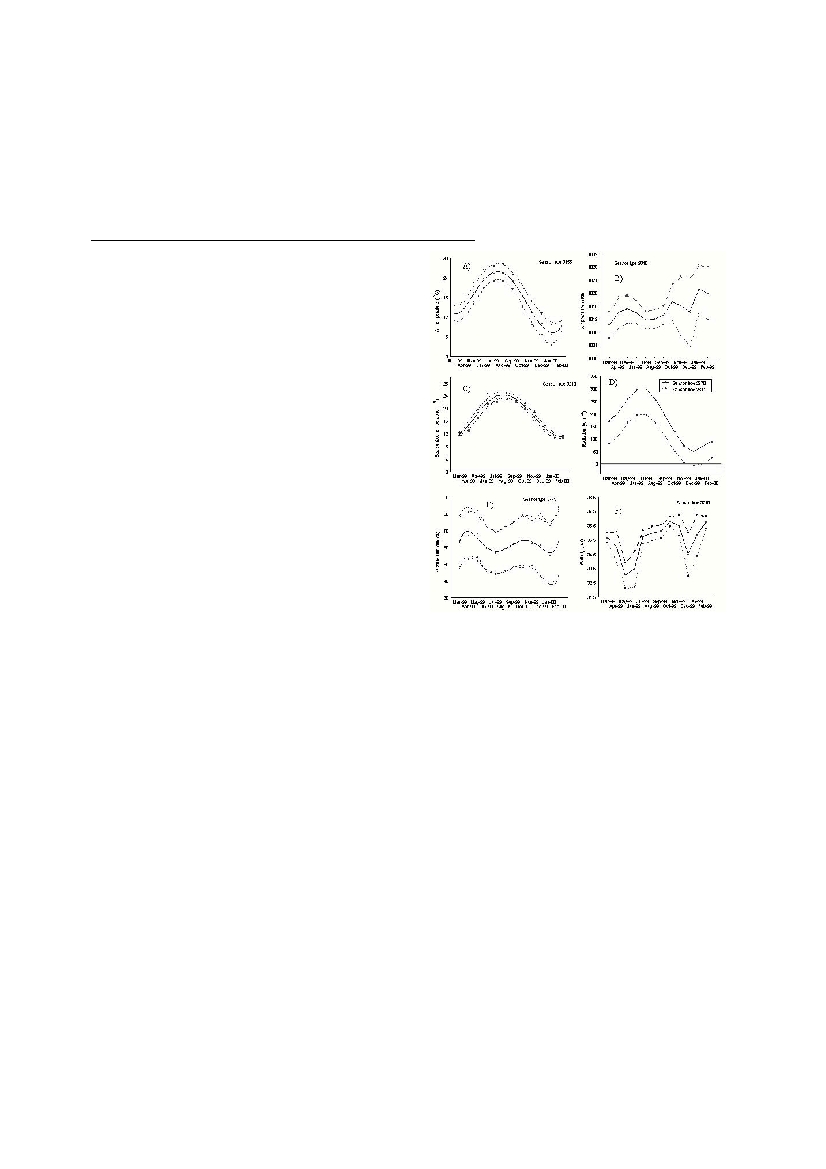
ature (Fig. 1C), compared to the daily mean air temperature (Fig. 1A)
showed that sea surface temperature was higher from September through
March, while air temperature was higher in the rest of the year.
Relative humidity (Fig. 1E) showed very high variability.The highest
variability was observed from December 1990 to February 2000. It varied
in the range from 25-90 %, while the mean value was 61%. Salinity
(Fig.1F) ranged from 29.82 - 37.51 psu, showing occasionally strong puls-
es of fresh water in fall and winter months, brought in the Kastela Bay by
Jadro River.The longer duration of fresh water intrusions occurred in
spring season. During most of the 1999, precipitation sensor was out of
work, so only data for period January, 2000-November, 2000 were plotted.
Very high monthly precipitation sum occurred in November 2000 as a
result of unusual weather conditions over Europe. Sea level records were
compared to the classical tide-gauge data showing equivalent response of
sea surface elevation (not shown). This re?ects seasonal heating/cooling
processes. The difference between the two temperatures was highest in
January (5şC). Fluctuations (not shown) within one month, reached about
10şC, for the air temperature, while sea surface temperature within one
month didn’t change more than 5şC. The strongest winds (not shown) from
N and NE were observed in winter season, however the northward direc-
tion was predominant in all the seasons. It is rather peculiar that character-
istic summer winds from W directions were not so energetic.
Conclusions
The statistical output, based on hourly values of all parameters, calcu-
lated first time for a station at the eastern Adriatic coast, matched with data
on the monthly scale obtained from a half century long classical measure-
ments at Marjan-Cape station.
Continuous measurements of relevant parameters by A
MOS
minimise
the undersampling error, which impact on output results gathered from
classical measurements.
References
(1) Buljan, M. and M. Zore-Armanda, 1966. Hydrographic data of the
Adriatic Sea collected in the period from 1952-1964.Acta Adriat.12: 1-438.
(2) Buljan, M. and M. Zore-Armanda, 1976. Oceanographical properties of
the Adriatic Sea. Oceanogr.Mar. Biol. Ann. Rev., 14: 11-98.
(3) Zore-Armanda, M., M. Bone, V. Dadic, M. Morovic, D. Ratkovic, L.
Stojanoski and I. Vukadin, 1991. Hydrographic properties of the Adriatic Sea
in the period from 1971 trough 1983. Acta Adriat.Vol. 32(1): 1-547.
(4) Morovic, M., Grbec, B., Beg Paklar, G., Dadic, V., and I. Vukadin, 1998.
The importance of oceanographic-meteorological station Split Marjan-Cape
for climatic ?uctuations studies. (Croatian). Conference: Thousand years since
the first written document related to Croatian fisheries. Editor: Finka, Bozidar,
Zagreb: Croatian Academy of Science and Art, Proceedings:459-467.
(5) Dadic, V. and D. Ivankovic, 1999. Automatic Meteo-Oceanographic mea-
surements and data transmission in real time to Internet. 41st ELMAR Int.
Symposium, Zadar.Proc.:114-118.
(6) Dadic, V., A. Puskaric, M. Glavurtic and M. Ferencak, 1990. General
Purpose Data Acquisition System. Techno-Ocean Int. Symposium, Kobe,
Japan. Proceedings: 62-66.
SOME RESULTS FROM THE AUTOMATIC METOCEAN STATION SPLIT MARJAN-CAPE
Vlado Dadic, Branka Grbec*, Damir Ivankovik, Frano Maticand Mira Morovic
Institute of Oceanography and Fisheries, Split, Croatia - dadic@izor.hr
Abstract
From the data measured in 10-minute intervals from March 1999 to February 2000 basic statistics of 10 meteorological and oceanographic
parameters were calculated.
Key words: Automatic Metocean Station Split, Adriatic Sea, undersampling error
Figure 1. Monthly means and monthly variances for the period March,
1999 - February, 2000 for A) air temperature; B) air pressure; C) sea tem-
perature; D) radiation; E) relative humidity; F) salinity.