Rapp. Comm. int. Mer Médit., 36,2001
66
Introduction
The two radiation parameters: global (incoming solar and sky radiation
within 0.3-2.5 µm) and net radiation (the difference between incoming and
outgoing radiation within 0.3-60.0 µm) measured from the A
M
O
S
(Automatic Metocean Station) station at Split Marjan-Cape were analyzed
in this work. The scope of this paper is to show differences in calculated
values when the data from different sampling intervals were used. The
methods for the heat ?ux calculations utilized here are presented in details
in Grbec et al. (1).
Results and discussion
For determination of individual components of thermal equilibrium, the
selection of formulae is very important. Heat ?u
xes for the Mediterranean
(2) showed different results from those in this work. The discrepancies
depended upon the selection of formulae used for calculation. Diff
e
r
e
n
t
results obtained using different input values can be also the reason for dis-
crepancies, as a result of undersampling. In order to demonstrate how larg
e
can be these differences on the seasonal scale, different input values were
used and the heat ?u
xes were calculated in the three ways: (Q
N
E
T
)
1
0
- based
on the row data (from 10 min intervals); (Q
N
E
T
)
d
- based on the daily means;
(Q
N
E
T
)
m
- based on the monthly means. These are listed in the table 1,
together with the amount of error, calculated using the following formula:
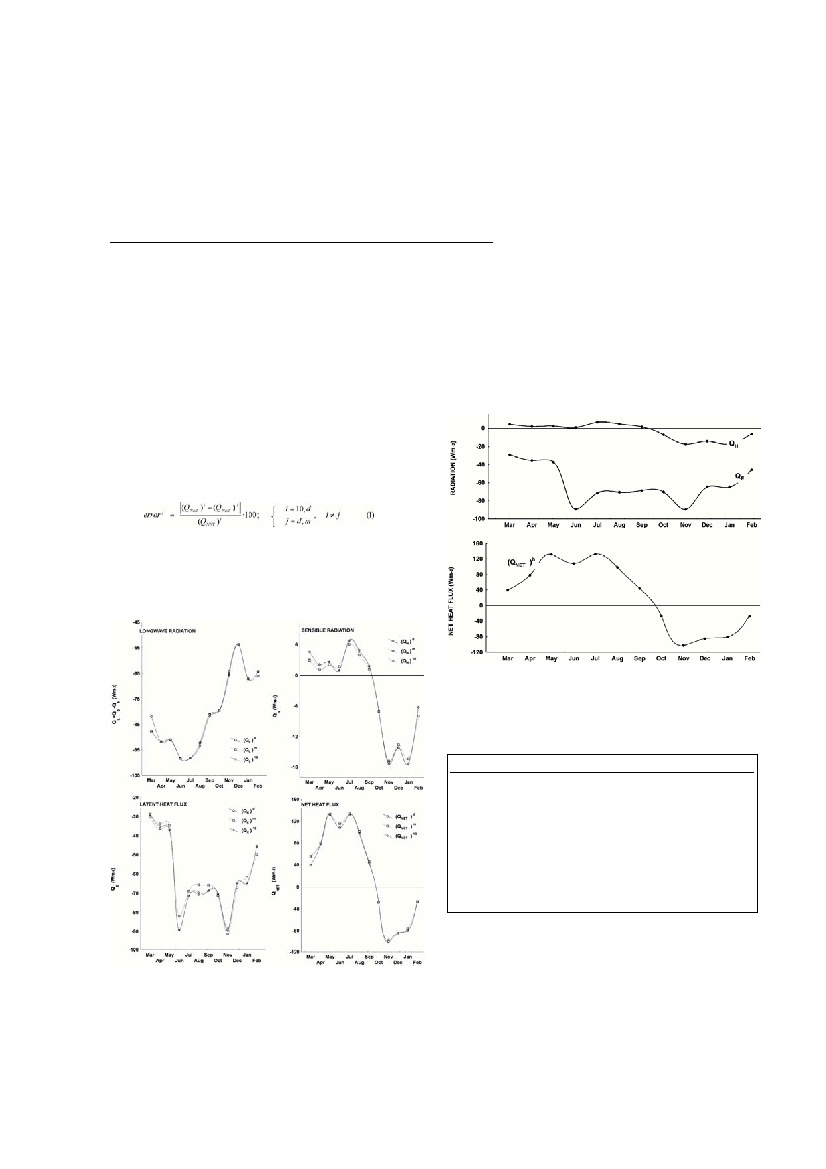
The ?uxes calculated from 10-min intervals, daily means and monthly
means are presented in the Fig. 1. Heat loss due to evaporation was higher
from March to September, and in January, than the others, calculated from
daily means or 10min intervals. However, the values were negative, re?ect-
ing that the heat loss due to evaporation was present all the seasons. This
shows that, calculating with monthly means, we may overestimate the heat
loss due to evaporation, up to 10% in June, or less in other months. From
March to September, sensible heat ?ux is positive, and the rest of the year
negative. Maximum values are reached in July and minimum in November
and January. In March, the heat gain due to conduction, calculated from
daily means, showed highest departure from the conduction calculated
from monthly means or 10min intervals. Heat loss due to long-wave radi-
ation was highest in June, and lowest in December. Only in March, the
departure between the values calculated from daily means and others was
considerable, and showed about 10% difference.
Resulting heat budget (Fig. 2) shows that the sea looses heat from
October to February and gains heat from March to September.The only
considerable departure between the results if different averaging is consid-
ered was in March, when daily mean values resulted in lower heat gain.
From the climatological point of view, it seems that daily values are good
enough for heat ?ux calculation.
Global and net radiation were measured with the error 20Wm
-2
, while
all other parameters were measured with the error neglectable in relation
to those originated form the mentioned equations. Since continuous mea-
surements of relevant parameters minimise the undersampling error, which
is important for better understanding of heat exchange.
References
(1) Grbec B., Dadic V., Ivankovic D., Morovic M. and Matic F., 2001. The
FirstYear of the Automatic Metocean Station Split Marjan-Cape-Preliminary
Results.Acta Adriat. 42 (1) July 2001 (in press).
(2) Garret C., Outerbridge R. and Thompson K., 1993. Interannual variability
in the Mediterranean heat and buoyancy ?uxes. J. Climate, 6: 900-910.
UNDERSAMPLING PROBLEM FOR HEAT FLUX CALCULATION
Branka Grbec*, Mira Morovic, Vlado Dadic , Damir Ivankovic and Frano Matic
Institute of Oceanography and Fisheries, Split, Croatia
Abstract
The results of the data analyses presented in this work consisted of the long-wave radiation, sensible and latent heat, calculated using the
bulk method. Errors due to undersampling of the calculated parameters were determined for different sampling intervals.
Kex words: Automatic Metocean Station Split, Adriatic Sea, undersampling error
Figure 1. Monthly mean a) global radiation, net radiation and longwave
radiation ?uxes, calculated from hourly means; b) monthly mean ?ux
lost/gained by evaporation and conduction calculated from hourly
means at the metocean station AMOS for the period March, 1999 -
Figure 2. Monthly mean net heat ?uxes (QNET ), calculated from hourly
means, at the metocean station AMOS for the period March, 1999 -
(Q
NET
)
d
Q
NET
)
m
Q
NET
)
10
(error)
d
error)
m
March39.1455.5654.6128.331.74
April77.8680.3778.120.332.89
May131.42133.13131.390.021.33
June108.03115.31108.080.056.69
July132.35133.46132.370.010.82
August98.17101.1897.590.593.68
September43.8345.4843.011.895.72
October-27.36-28.58-27.360.004.45
November-102.37-101.89-98.933.472.98
December-84.86-86.84-84.860.002.34
January-80.44-76.84-80.440.004.47
February-27.72-26.58-27.720.004.12
Table 1. Errors according to equation 1 for heat ?uxes calculated from
10 minutes intervals relative to the monthly means and, from daily
means relative to the monthly means (%), and heat ?ux (Wm-2) calcula-