Rapp. Comm. int. Mer Médit., 36,2001
72
Introduction
The biological production heterogeneity of the Ligurian Sea is closely
associated with local and regional hydrodynamical factors, especially
those responsible for a high variability of the mixed layer depth in such a
strongly stratified environment. This area is typically oligotrophic and
therefore, any supply of nutrients is extremely important for the primary
production. Moreover, the overall system is dominated by a marked sea-
sonal cycle as a result of the meteorological signal, with high phytoplank-
ton biomass observed during cold windy winter-spring period. The inten-
sity of winter-spring phytoplankton bloom also performs a significant
interannual variability.The difference between two seasonal cycles (from
October 1997 to September 1999) illustrates the response of phytoplank-
ton dynamics to local meteorological conditions. We develop here a model
in order to explain the observations obtained from satellite data [3], espe-
cially the higher phytoplanktonic biomass found in 1999. Considering that
the establishment and decay of the thermocline are strongly dependent on
the atmospheric conditions, the model will be forced by surface wind stress
and heat ?uxes computed from real meteorological conditions, a high rate
sampling meteorological data allowing simulations that give confidence in
the mixed layer dynamics [4].
Model
The coupled MODECOGeLmodel, implemented, calibrated and vali-
dated for the northern Ligurian Sea using long term (1984–1988) experi-
mental data from the French Frontal program surveys, is thoroughly pre-
sented in [1][2]. The hydrodynamic model is a 1D version of the multi-lev-
els, turbulent closure, G.H.E.R. (GeoHydrodynamics and Environment
Research, University of Ličge, Belgium) model. The ecosystem model is a
12 state variables one based on the L.O.B.E.P.M. (La
b
o
r
a
t
o
i
r
e
d'OcéanologieBiologique et d'Ecologie du PlanctonMarin, University of
Paris VI, Villefranche-sur-mer, France) works. It takes into account 12
state variables based on size-classes. It is worth attention that, while the
annual average of wind intensity was higher during the year 1997/1998
than in 1998/1999 (5.07 m/s versus 4.94 m/s), the year 1997/1998 was
characterized by higher winds during autumn, spring and summer while
during the year 1998/1999 the winter was windier.The winter winds are
particularly important for the deepening of the mixed layer.
Results and discussion
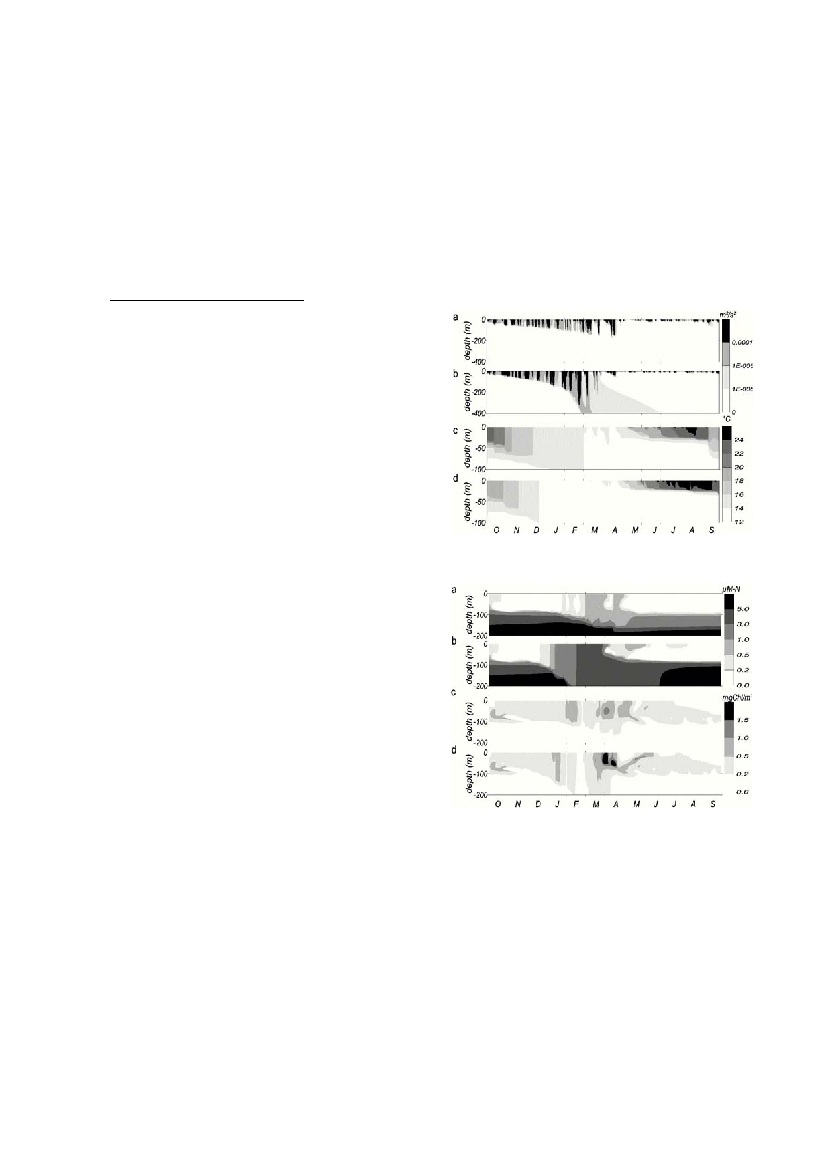
Among the results of the model, we will focus on distributions of tur-
bulent kinetic energy (Figures 1a and 1b) and temperature (Figures 1c and
1d) for both periods (97/98 and 98/99). The observation of the turbulent
kinetic energy indicates that winter mixing was clearly more intense in
1999, where the mixed layer deepened down to 400 m at the end of
February.The beginning of the stratified period started in May.This effect
was faster in May 1999 (windier than May 1998) while the surface warm-
ing was higher in May 1998. As soon as the end of May, this tendency was
reversed. In 1999, the summer (less windy) was characterized by a higher
surface temperature and a sharp thermocline. This one was less deep than
in 1998. The end of September 1998 was marked by a strong wind event
followed by a drop of the mixed layer depth and the thermocline. The com-
plete destratification took place sooner in winter 1998/1999 as compared
to winter 1997/1998 because of a windier winter.
Figure 2 shows the time-depth distribution of nitrate and chlorophyll for
both years. It appears clearly that the 1999 bloom is higher than the one in
1998. At the light of physical results one can explain the higher phyto-
planktonic biomass in 1999. The year 1999 shown a very strong winter
mixing – as compared to 1998 – that could allow an important nutrients
supply in the surface layer, giving rise to an intense spring bloom. An
important nutrient input constitutes storage for the summer and should
allow, in favourable meteorological conditions, to ensure a summer more
intensive phytoplanktonic production despite of the strong stratification.
On the other hand, during winter 1997/1998, the less intense mixing is not
sufficient to bring up high nutrients concentration into the euphotic layer,
resulting thus in a weaker phytoplanktonic production.
References
[1] Lacroix G., 1998. Simulation de l’écosystčme pélagique de la mer Ligure
ŕ l’aide d’un modčle unidimensionnel; étude du bilan de matičre et de la vari-
abilité saisonničre, interannuelle et spatiale, PhD dissertation, University of
Paris VI (France), University of Ličge (Belgium), 256pp.
[2] Lacroix G., 2001. Ecosystem model (MODECOGeL) of the Ligurian Sea
revisited. Seasonal variability and pluriannual simulation. Submitted to J. Mar.
Syst.
[3] Nezlin N.P., Lacroix G., KostianoyA.G. and Djenidi S., 2000. Remotely
Sensed Seasonal Dynamics of Phytoplankton in the Ligurian Sea in
1997–1999. Submitted to J. Geophys. Res.
[4] Lacroix G. and Nival P., 1998. In?uence of meteorological variability on
primary production dynamics in the Ligurian Sea (NW Mediterranean Sea)
with a 1D hydrodynamic/biological model, J. Mar. Syst., 16, 23–50.
ECOSYSTEM RESPONSE TOTHEATMOSPHERIC FORCING
IN THE SOUTHERN LIGURIAN SEA IN 1997–1999
Genevieve J. Lacroix
1
*, Nikolay P. Nezlin
2
and Salim Djenidi
1
,
1
GHER, University of Liege, B5 Sart Tilman, 4000 Ličge, Belgium - G.Lacroix@ulg.ac.be
2
P.P. Shirshov Institute of Oceanology, Moscow, Russia - nezlin@biology.ucla.edu
Abstract
A coupled hydrodynamic-biological model — MODECOGeL[1, 2] — is applied to the southern Ligurian Sea. The model is forced with
a high sampling meteorological data measured from an automatic weather station located in STARESO (Calvi, Corsica). Two simulations
(from October 1997 to September 1998 and from October 1998 to September 1999) have been performed with the model. The results cor-
roborate the general pattern of phytoplankton seasonal dynamics observed in SeaWiFS remote-sensed data and, in particular, the higher
phytoplanktonic biomass observed in 1999 is well reproduced by the model [3].
Keywords: Ligurian Sea, models, blooms
Figure 1. Time-depth evolution of the physical variables computed by
the model. Turbulent kinetic energy (a) in 1997-1998 and (b) in 1998-
1999. Temperature (c) in 1997-1998 and (d) in 1998-1999.
Figure 2. Time-depth evolution of the biological variables com-
puted by the model. Nitrate (a) in 1997-1998 and (b) in 1998-
1999. Chlorophyll (c) in 1997-1998 and (d) in 1998-1999.