Rapp. Comm. int. Mer Médit., 36,2001
88
Introduction
The seiches in harbours and small basins can be of high importance
when the ships are entering there, as they can produce a rather strong
currents and large sea level displacements [1]. In the Adriatic, the
investigations of seiches in small basing started early in the century
[2], and periods of oscillation were estimated for a great part of the
basin where tide-gauges were mounted [3]. Moreover, an extreme
strong events were observed in some parts of the Mediterranean [4,5]
and Adriatic [6], as a consequence of resonant air pressure forcing on
sea levels near seiche period, so-called Proudman resonance [6], hav-
ing sea-level amplitudes up to 3 m and producing and extreme dam-
ages on the infrastructure affected by the event.
Data and methods
Dataset analyzed in this paper is collected in the period August-
October 2000, comprising air and sea pressure measured at the tide
gauge placed near the entrance of the harbour within MedGLOSS pro-
ject. Air pressure is measured every 2 minutes, whereas bottom pres-
sure data resolution is 0.5 minutes. In addition, sea-level data mea-
sured at the old ?oat-type tide gauge will be examined, as it is posi-
tioned far from the harbour entrance.
The methods of analysis applied here include spectral analysis [7]
(40 degrees of freedom) in order to visualize energy peaks related to
the seiche and other oscillatory movements in the harbour, high and
band pass filtering on the resonance frequency (11.9 min), and finally
analytical and numerical 2D barotropic modelling of the harbour
seiches. The modelling is done by applying backward-forward numer-
ical procedure and by assuming zero sea level displacement at the
entrance of the harbour and zero horizontal velocity on the side walls.
Results
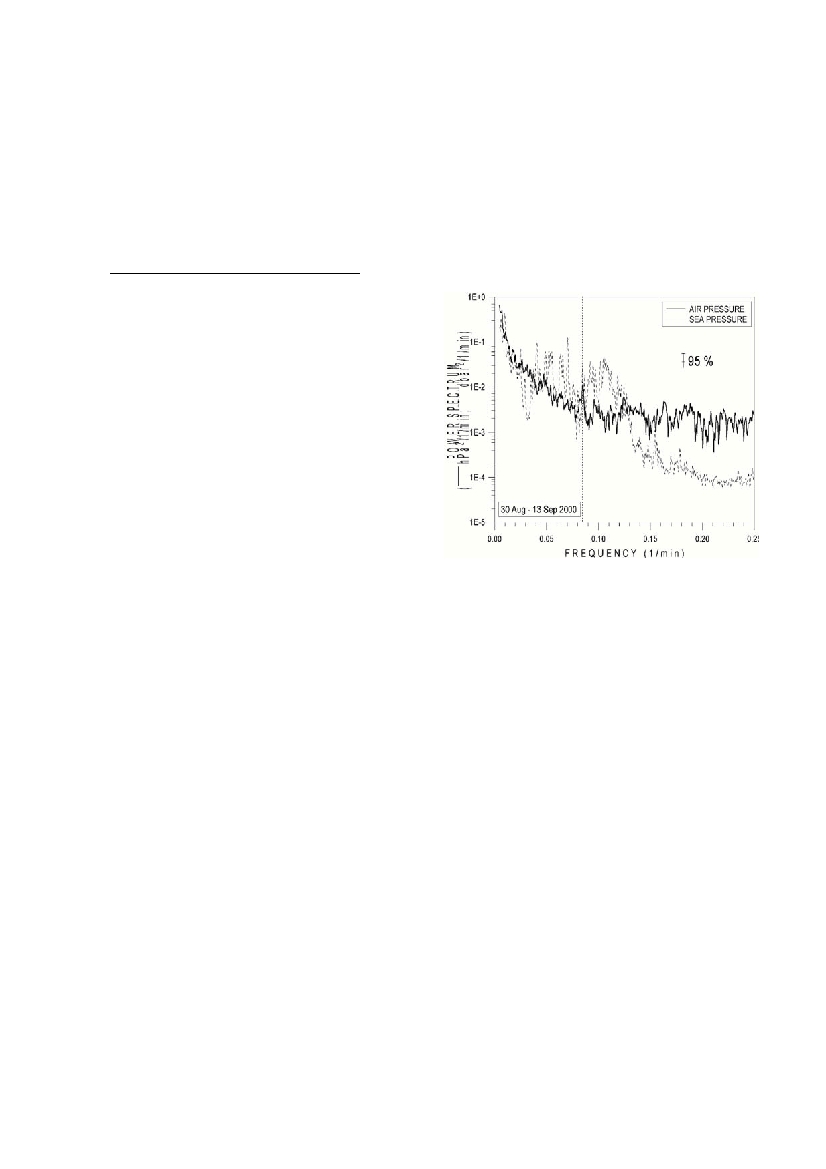
Power spectra, both of the bottom and air pressure, are given in
Fig1 (periods higher than 4 min). A number of energy peaks can be
seen in the frequency range between 0.04 and 0.12 min
-1
(8.3 and 25
min), but its origin cannot be precisely defined: they can belong to res-
onant oscillation forced by air pressure or to the seiches of some wider
area. The first mode occurs at a period of 6.6 min, but with no strong
energy as the tide gauge is positioned near the entrance of the harbour
(nodal line). Higher modes can be detected on periods of 3.0, 2.2, 1.6
and 1.15 min, revealing higher seiche modes of the whole harbour or
oscillation of some parts of the harbour.Applying 2D barotropic
model on the harbour, the theoretical period of the uninodal seiche is
calculated to be 7.3 min during the low tide, but it falls to 6.9 min
when adding 0.7 m (tide + storm surge) on sea level in the harbour.
Higher theoretical modes can be traced on periods of 5.1, 3.1, 2.2, 1.64
and 1.24 min, thus they reproduce the empirical period well.
An interesting peak can be traced both on the air and sea pressure
spectra on frequency of 0.084 1/min (11.9 min). Thus, an intense
oscillatory movement occurred in the atmosphere forcing sea level to
oscillate, during the storm passage on 31 August / 1 September 2000.
Gain between air and sea is –14 cm/hPa. Fortunately, the resonant
oscillation was not placed in the frequency area with high energies,
thus, no strong oscillation occurred in the harbour. Maximum ampli-
tude of air and sea pressure can be estimated to be 0.3 hPa and 0.45
dbar (4.5 cm) by applying very narrow band-pass filter. Nevertheless,
if the resonant movement occurs on the seiche or near-seiche periods,
resulting sea level amplitude can rise enormously, as happened in a
number of places [4,5] such as Vela Luka Bay [6], where the resonance
appeared with maximum sea level amplitude of about 3 m.
References
1 - Wu J., Tsanis I.K. and Chiocchio F., 1996. Observed currents and
water levels in Hamilton harbour.Journal of Great Lakes Research, 22,
2: 224-240.
2 - Sterneck R.v., 1914. Ueber “Seiches” an den Kuesten der Adria.
Sitzungberichte der Kaiserliche Akademie der Wissenschaften,Wien,
Iia/123: 2199-2232.
3 - Vilibic I. And Orlic M., 1999. Surface seiche and internal Kelvin
waves observed off Zadar (East Adriatic). Estuarine, Coastal and Shelf
Science, 48: 125-136.
4 - Candela Perez J., Mazzola S., Sammari C., Limeburner R., Lozano
C.J., Patti B. and Bonano A., 1999. The “Mad Sea” phenomenon in the
Strait of Sicily.Journal of Physical Oceanography, 29: 2210-2231.
5 - Gomis D., Monserrat S. and Tintore J., 1993. Pressure-forced seiches
of large amplitude in inlets of the Balearic Islands. Journal of
Geophysical Research, C98, 14437-14445.
6 - Orlic M., 1980. About a possible occurrence of the Proudman reso-
nance in the Adriatic. Thalassia Jugoslavica, 16, 1: 79-88.
7 - Jenkins G.M. and Watts, D.G., 1968. Spectral Analysis and Its
Applications, Holden Day, NewYork, 532 pp.
HIGH-FREQUENCY SEA LEVEL OSCILLATIONS OBSERVED AND
MODELLED IN THE SPLIT HARBOUR (ADRIATIC SEA)
IvicaVilibic*, Hrvoje Mihanovic
Hydrographic Institute of the Republic of Croatia, Split, Croatia - dhi-oco@dhi.tel.hr
Abstract
The paper deals with the high-frequency analysis based on the data of pressure gauge located in the Split harbour, collecting the data of
sea and air pressure. The analysis included the spectral analysis and filtering, revealing harbour seiches having periods of 6.5, 3.0, 2.2, 1.6
and 1.15 min. The seiches were modelled and verified numerically. Furthermore, a strong peak was found on period of 11.9 min of air
pressure data, highly correlated to the sea pressure with phase lag of about 90o and gain of about 14 cm/hPa.
Keywords: Adriatic Sea, sea level, atmospheric input
Figure 1: Power spectra of the air and sea pressure measured
on the MedGLOSS tide gauge.