Rapp. Comm. int. Mer MÚdit., 36,2001
169
Introduction
The development of ôcleanö techniques has led to a sharp increase in
studies on the geochemistry of trace metals and their roles as limiting nutri-
ents for oceanic primary production. These studies require the use of bulk
size-fractionation techniques to isolate organisms or particles from their
surrounding liquid medium for analysis. Typically, whole water is collect-
ed and filtered either serially or in parallel through 0.2, 2.0 and 20 Ám
membrane filters to divide the particles into the corresponding biological
size classes of pico-, nano-, and microplankton (1). The filters are then
rinsed and analyzed for metal content. This approach can only provide
information about the metal contents of the trapped particles in aggregate.
In situations where there is a mixed assemblage of microbial organisms (as
is usually the case in natural waters), this "bulk chemistry" technique can-
not distinguish metal concentrations in different organisms of the same
size or between living and abiotic particles. Additionally, heterogeneity
among cells of the same species is not assessed, as all of the particles in a
certain size class are grouped together for analysis.
Materials and methods
We have attempted to overcome the limitation of bulk- chemistry metal
analysis through the use of a high-brilliance synchrotron x-ray ?uores-
cence microprobe at the Advanced Photon Source (APS) at Argonne
National Laboratory.This instrument uses highly-focused x-rays to induce
?uorescence in metal atoms within individual plankton cells (2). Natural
plankton samples are mounted on EM grids, and individual cells of inter-
est are identified either through light or epi?uorescence microscopy.The
grids are then mounted in the x-ray microprobe and the same cells identi-
fied and characterized by light microscopy are targeted and scanned with
the x-ray beam. The optics of the x-ray beam can be adjusted to increase
photon ?ux (increasing sensitivity) or to reduce the area of the beam
(increasing resolution). At each pixel in the two dimensional scan, the ele-
ments present in the sample are excited by the incident x-ray beam and
emit ?uorescent photons at characteristic energies, producing a ?uores-
cence spectra for each pixel detected by germanium lithium detectors. The
?uorescence intensity is quantified and converted to metal concentration
through the use of standards. The technique is similar to energy-dispersive
x-ray ?uorescence used to quantify elements in macrophyte algae (3).
Without the brilliant x-rays provided by the synchrotron, however, this
technique lacks the sensitivity to measure metals in single-celled plankton
samples. New third-generation synchrotrons such as the APS provide the
necessary x-ray intensity.Additionally, advances in x-ray optics have
reduced the size of the incident x-ray beam, increasing the resolution of the
instrument to 0.2 Ám (or 0.04 Ám
2
). The microprobe has the sensitivity to
quantify and map Si, Ca, K, Fe, Cu, and Zn (and potentially Cr, Mn, Ni,
As, and Se) in individual planktonic particles. The high resolution allows
us to quantify element concentrations in different particles and to map the
distribution of metals within single particles. We have used this novel tech-
nique to quantify elemental concentrations in several different classes of
nanoplankton collected off the coast of Southampton, NY. In order to pre-
sent the results as cellular concentrations, cellular metal contents were nor-
malized to biomass by assuming a squashed ellipsoidal cell shape in com-
bination with published estimates of C:volume ratio for each type of cell
(4-6) and assuming C:dry weight conversions of 3 for ciliates and ?agel-
lates and 4 for diatoms. We examined two oligotrichous Strombidium-like
ciliates 15 Ám in diameter, 6 large Thalassiosira-like centric diatoms (25
Ám diameter), and 5 small autotrophic ?agellates (6 Ám diameter).
Results and discussion
The measured concentrations of K, Ca, Fe, Cu, and Zn in ciliates,
diatoms and ?agellates are shown in Table 1. We included K and Ca in our
results as possible indicators of cellular biomass. These are the first report-
ed results, to our knowledge, of metal concentrations in individual phyto-
plankton and protozoa cells. All of the samples were collected from the
same site and the ciliate and diatom cells appear to be of the same genus,
respectively.Although these results are based on a small sample size, they
suggest that there is considerable variation in the metal concentrations of
similar cells from the same location as well as between the different cell
types. The diatoms show the highest metal concentrations of all the cells,
and the ?agellates have significantly lower concentrations than the two
groups of larger cells. The concentrations of Fe, Cu, and Zn in the ciliates
and ?agellates are within the range of values reported for plankton from
bulk chemical measurements taken during a diatom bloom off Monterey,
CA (7), but the diatoms in the present study have Fe and Cu concentrations
that are 135% and 231% higher, respectively. Our results might be expect-
ed to be higher since the other study included all plankton-sized particles,
including detritus that may have had lower metal concentrations.
This technique also shows promise as a tool for studying the internal
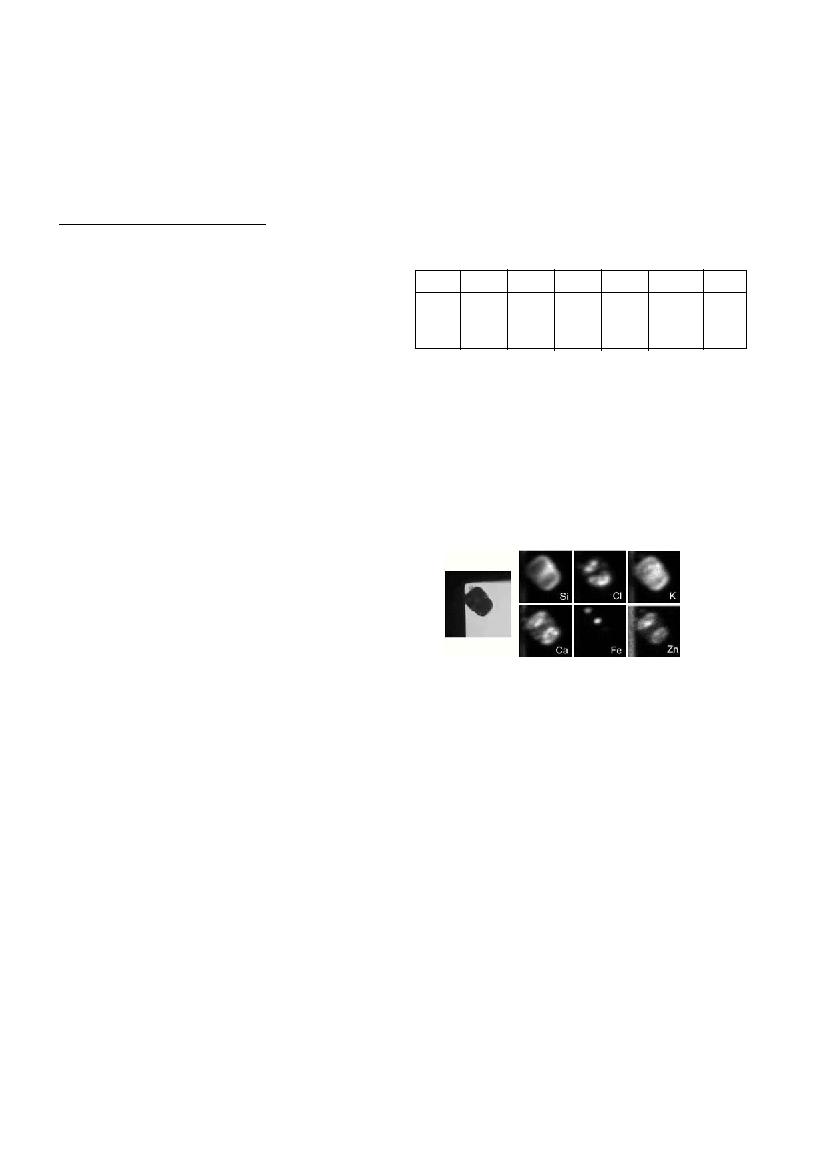
distribution of metals within individual plankton cells. Fig. 1 shows the
distributions of 6 elements in one of the diatom cells. The elemental con-
centrations vary spatially: Si is primarily found in the exterior test of the
cell; Cl, Ca, and Zn are more common in the organic biomass of the cell,
as shown by their density in the two frustules of the cell; Fe appears to be
highly localized in the upper frustule.
References
1.Twiss M.R. and Campbell P.G.C., 1998. Scavenging of
137
Cs,
109
Cd, 65Zn,
and 153Gd by plankton of the microbial food web in pelagic Lake Erie sur-
face waters. J. Great Lakes Res., 24: 776-790.
2. Sparks C.J., 1980. X-ray ?uorescence microprobe for chemical analysis, pp.
459-512In:Winick, H. and Doniach S. (eds.), Synchrotron radiation research,
Plenum Press, NewYork.
3. Carvalho M.L, Ferreira J.G., Amorim P., Marques M.I.M. and Ramos M.T.,
1997. Study of heavy metals and other elements in macrophyte algae using
energy-dispersive x-ray ?uorescence. Environ. Toxicol. Chem., 16: 807-812.
4. Hansen P.J., Bjornsen P.K. and Hansen B.W., 1997. Zooplankton grazing
and growth: scaling within the 2-2,000 um body size range. Limnol.
Oceanogr., 42: 687- 704.
5. Borsheim K.Y. and Bratbak G., 1987. Cell volume to cell carbon conver-
sion factors for a bactivorousMonassp. enriched from seawater.Mar.Ecol.
Prog. Ser., 36: 171-175.
6. Strathmann R.R., 1967. Estimating the organic carbon content of phy
to-
plankton from cell volume or plasma volume. Limnol. Oceanog
r., 12: 411-418.
7. Martin J.H. and Knauer G.A., 1973. The elemental composition of plank-
ton.Geochim.Cosmochim. Acta, 37: 1639-1653.
MEASUREMENT OF ELEMENT CONCENTRATIONS IN MARINE NANOPLANKTON CELLS
USING AN X- RAY FLUORESCENCE MICROPROBE
Benjamin S. Twining,* Stephen B. Baines, and Nicholas S. Fisher
Marine Sciences Research Center, State University of NewYork, Stony Brook, USA - btwining@ic.sunysb.edu
Abstract:
A novel technique is described for the quantification and localization of trace elements in marine nanoplankton that utilizes brilliant syn-
chrotron x-rays to excite ?uorescence. Thirteen individual cells, including ciliates, diatoms, and autotrophic ?agellates collected off the
coast of NewYork were analyzed for K, Ca, Fe, Cu, and Zn. There was considerable variability in trace metal concentrations both within
and among taxa from a single site. This technique for studying the distribution of elements within single cells may provide a unique under-
standing of metal-biota interactions.
key words: synchrotron; metals; plankton
Table 1. Concentrations of five metals in marine ciliates (n = 2 cells
examined), diatoms (n = 6 cells), and ?agellqates (n = 5 cells). Mean val-
ues (Ág g-1 dry wt) and standard deviations (SD) are given.
ElementCiliatesSDDiatomsSDFlagellatesSD
(n=3)
(n=6)
(n=5)
K16,78120,85735,75921,5331,546934
Ca8,2642,77219,77216,5272,3971,413
Fe4241178095758740
Cu33714069318388111
Zn10602951343722
Fig. 1: The first image (right) is a light micrograph of a diatom.
The other six images show the distribution of Si, Cl, K, Ca, Fe,
and Zn within the same cell, based on x-ray ?uorescence.