Rapp. Comm. int. Mer Mťdit., 36,2001
182
Introduction
Metallothioneins (MTs) are a family of low-molecular-weight, cys-
teine-rich proteins that have a high affinity for divalent ions. MTs play
important roles in the regulation of essential trace metals, such as zinc and
copper, and in the detoxification of heavy metals, such as cadmium and
mercury. Recently, MT level has become a major biomarker for monitor-
ing metal pollution in fish, and it has been included in several Monitoring
Programmes, such as the Joint Assessment Monitoring Programme
(JAMP) or the Mediterranean Pollution Monitoring Programme (MED-
POL), as an early indicator of biological effects of heavy metals.
Material and methods
Specimens of Mullus barbatuswere caught by trawling before (May
1999) and after (October 1999) the spawning season, in six areas along the
Iberian Mediterranean coast (Fig. 1) exposed to different degrees of anthro-
pogenic activities. Water temperature and salinity was recorded at each
sampling. Individual striped mullet were sexed, weighed, length measured
and liver removed. MTs content was measured applying the spectrophoto-
metric assay, adapted from Viarengo et al (2, 3), based on the estimation of
the sulfhydryl content of MT proteins using Ellmanís reagent.
The in?uence of size in hepatic MT was studied applying a curvilinear
regression analysis in order to obtain the determination coefficients (R
2
)
for different models. The relationships between both variables were eval-
uated applying the F-test with regression ANOVA using specimens, with
the same gender, captured in six areas, before and after spawning.
The in?uence of gender in hepatic MT was studied applying one-way
ANOVA on log-transformed data. Specimens within the size range 14 to
18 cm, captured in three different areas before and after spawning, were
used in this analysis.
The in?uence of maturation state in hepatic MT was assessed applying
one-way ANOVA on log-transformed data. Specimens within the size
range 14 to 18 cm, captured in two different areas before and after spawn-
ing, were used in this analysis.
Results and Discussion
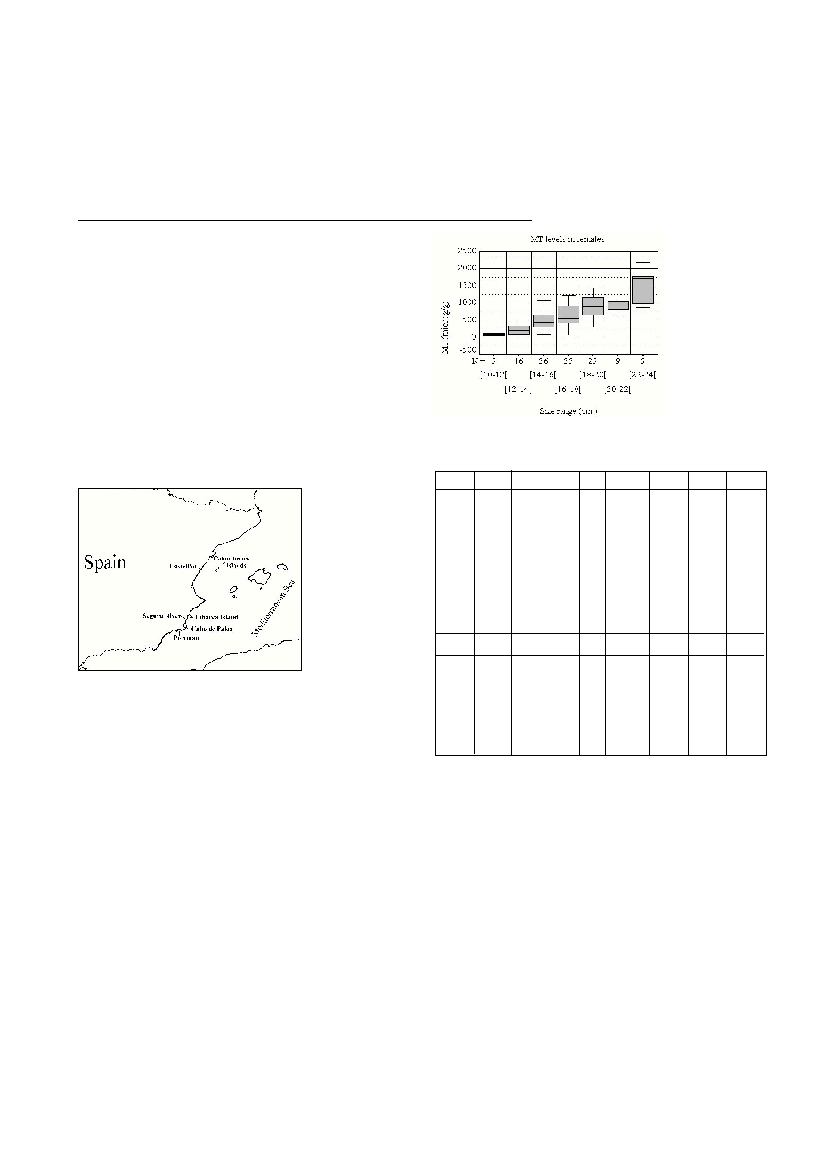
The results of the regression analysis showed the existence of signific
a
n
t
p
o
s
i
t
ive relationship between size and MT content in the six cases studied
(p < 0.05; Fig. 2). Furthermore, variability of the data was better ex
p
l
a
i
n
e
d
by the power model [MT] = b
0
+ size
b 1
( R
2
= 0.203;
p < 0.05). Significant differences in MT levels between male and female
specimens were found in all cases during prespawning but not during
postspawning period (p < 0.05). Mean MT was always bigger in females
(Table 1). We have also found significant differences in MT levels
between specimens (belonging to the same gender) captured in prespawn-
ing and postspawning period in all cases studied. Mean MT was always
higher during prespawning period (Table 1).
Conclusions
Our results showed that the use of MT levels in Mullus barbatusneces-
sitates the utilization of specimens within a same size range in order to
reduce variability and allow standardized comparisons. Considering that
specimens within a size range 14 to 18 cm were most abundant and their
liver size was appropriate for analysis, we propose this size class for com-
parative purposes. The reported in?uence of gender and maturation state
on MT levels have shown the necessity to establish the sampling time and
to study independently specimens of different sex. Since variability of
data was lower in postspawning periods than in prespawning, it is advis-
able to carry out the sampling outside the prespawning period.
References
1. Hylland, K., Nissen-Lie, T., Christensen, P.G. and Sandvik, M., 1998. Natural
modulation of hepatic metallothionein and cytochrome P4501A in ?ounder,
Platichtys ?esus L. Mar. Environ. Res., 46 (1-5): 51-55.
2. UNEP/RAMOGE, 1999. Manual on the biomarkers recommended for the
MEDPOL Biomonitoring Programme.
3.Viarengo, A., Ponzano, E., Dondero, F. and Fabbri, R., 1997. A simple
spectrophotometric method for MT evaluation in marine organisms: an application
to Mediterranean and Antarctic molluscs. Mar. Environ. Res., 44 (1): 69-84.
INFLUENCE OF BIOTIC FACTORS ON METALLOTHIONEIN LEVELS IN MULLUS BARBATUS COLLECTED
FROM THE IBERIAN MEDITERRANEAN COAST.
J. Benedicto*, C. MartŪnez , J.A. Campillo, F. MartŪnez and E. Marull.
Centro OceanogrŠfico de Murcia, Instituto EspaŮol de OceanografŪa, San Pedro del Pinatar, Murcia, Spain - benedicto@mu.ieo.es
Abstract
The objective of this study was to determine the in?uence of some biotic factors (gender, size and sexual maturity) on the concentration of hepatic
metallothionein (MT) in the demersal fish Mullus barbatus, as a initial step for the ultimate identification of basal levels of this biomarker.The
in?uence of biotic factors was assessed applying polynomial regression models and one-way ANOVA. The results confirm previous findings (1)
that the biotic factors considered must be taken into account in biomarker monitoring as they could affect the fish MT system.
Key words: Mullus barbatus, bio-indicators, pollution, Western Mediterranean, coastal waters.
GenderDateSitenMT MeanSt. ErrorFp
MaleMaySegura river1819,2130,06586,0600,000*
Female
Segura river6125,8280,025
MaleMayTabarca I.2918,1430,06333,1580,000*
Female
Tabarca I.3022,7340,046
MaleMayColumbretes I.1018,2560,05562,5450,000*
Female
Columbretes I.1823,6370,036
MaleOctoberCabo de Palos3612,6890,0574,5910,037*
Female
Cabo de Palos1713,3110,072
MaleOctoberTabarca I.1613,8960,0310,2440,624
Female
Tabarca I.2614,0130,043
MaleOctoberColumbretes I.1313,3720,0520,5650,575
Female
Columbretes I.1413,6120,047
DateGenderSitenMT MeanSt. ErrorFp
MayFemaleTabarca I.3722,3110,046381,10,000*
October
Tabarca I.4014,0190,035
MayFemaleColumbretes I.3123,1120,034467,90,000*
OctoberColumbretes I.1413,6120,047
MayMaleTabarca I.5217,6710,04569,610,000*
October
Tabarca I.1713,8800,030
MayMaleColumbretes I.3017,3210,05673,810,000*
OctoberColumbretes I.1413,4160,050
Table 1. Results of the in?uence of gender and sexual maturity
on MT contents (Ķg /g hepatic tissue) in Mullus barbatus. (*)
Statistically significant differences.
Figure 2 : I,?u-
enceof size on
MT levels in
Mullus barbatus
collected in May
1999 at
Portman.R
2
=
Figure 1 : Map of
sampling sites.