Deep water nitrate:phosphate ratios in the eastern Mediterranean basin have been
shown to be well above Redfield (1) Combined with the observation that surface het-
erotrophic bacterial communities in the eastern basin (2), and phytoplankton as well
as bacterial communities in the north-western Mediterranean (3) appear phosphate-
limited, this has led to the suggestion that the Mediterranean surface ecosystem may
be relatively simple in the sense that osmotrophs are limited by phosphate, rather than
nitrogen, organic carbon, silicate, or combinations of these (4) (Fig. 1). As part of a
more critical investigation of these suggested relationships, we here report results
from a microcosm study designed primarily to test the response to phosphate addition
of the microbial ecosystem in eastern Mediterranean surface water.
Experimental design and rationale
Seawater pumped from 10m-depth 30 km west of Haifa during May 14 2000, was
filtered on 125 µm mesh plankton nets to remove large grazers, and dispensed into
25L high-density polyethylene carboys that had been pre-treated with seawater, acid
washed, and rinsed with seawater from the sampling station. The carboys were incu-
bated in a circulating seawater (21°C) tank under subdued natural light conditions.
Nutrient additions were made as single doses on Day 0 (May 15), according to the
scheme in Table 1. Chl-a was determined by HPLC, primary production from
14
C-
incorporation in light-dark bottles incubated at mid-day, and orthophosphate
turnover-time from incorporation of
33
P after short-term incubation with H
333
PO
4
.
Based on the hypothesis of a P-limited state of the food web, the four treatments with
increasing phosphate dose (#2, #3 and #4) were expected to reveal an increasing
response relative to the untreated control (#1). For a sufficiently large P-dose, the sys-
tem was expected to be shifted into N-deficiency. In this case, continued growth was
expected in the corresponding Treatments #6, #7, or #8, supplied with excess nitrate-
N.Treatment #9 was given glucose as a negative control to confirm the expectation
of no bacterial response to the addition of a degradable carbon source.
Results and discussion
No response could be found in bacterial biomass or activity to the addition of glu-
cose alone (#9, data not shown. As evidenced by the diatom bloom induced, the free
silicate in the collected water (1.1 mmol-Si m
-3
) was bioavailable.Together, these
observations support the hypothesis that the system was not constrained, neither by
organic-carbon limitation of heterotrophic bacteria on the left, nor by silicate limita-
tion of diatoms on the right side of Fig. 1. An increasing response to increasing phos-
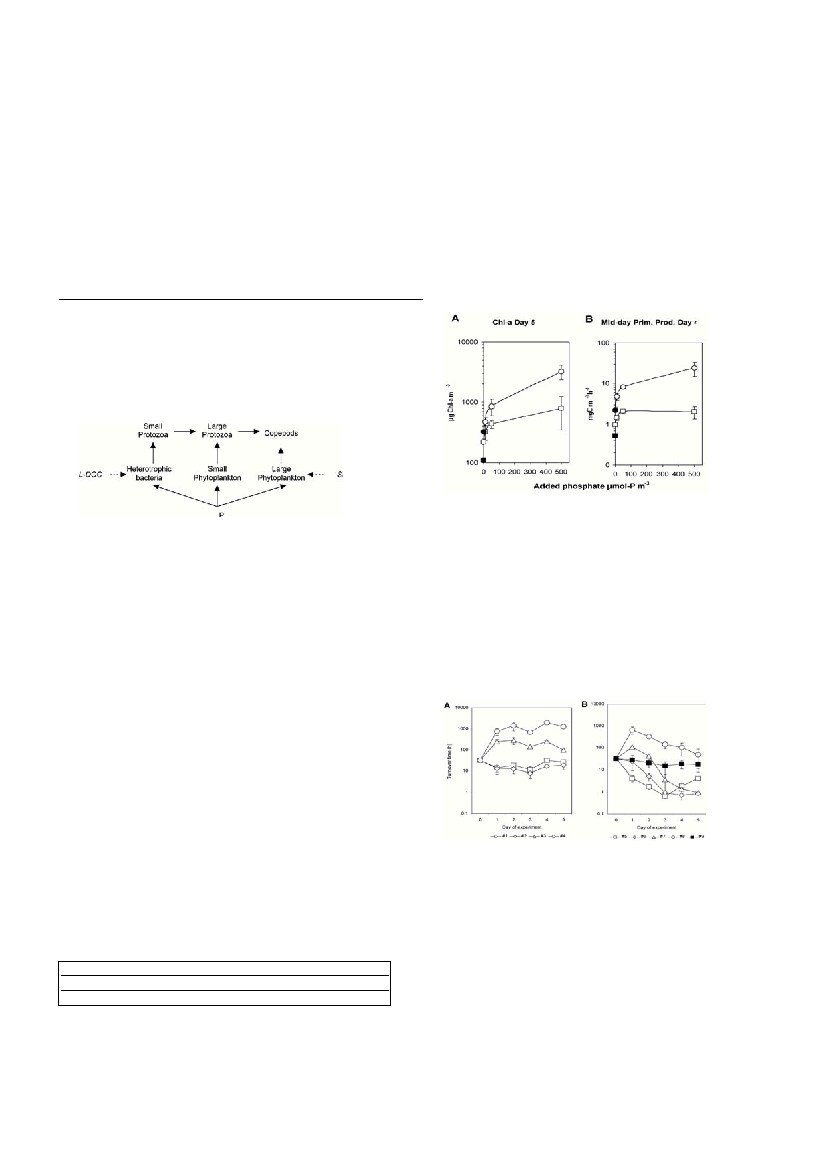
phate-alone addition was found in both chlorophyll and in primary production
(Fig.2). Saturation of the response occurred for additions around 50 µmol-P m
-3
.
Assuming a Redfield ratio of 16:1, this corresponds to the mobilisation of an N-
reserve around 800 µmol-N m
-3
. However, adding nitrate alone (#5) also had a stim-
ulatory effect on both primary production and chl-a (Fig.2). Also, turnover-time of
orthophosphate increased in carboys with phosphate added alone in doses >10 µmol-
PO
4
m
-3
(Fig. 3A), while adding nitrate alone (Fig. 3B) led to a decrease in turnover-
time. Except for the absence of significant effects from adding 10 µmol-PO
4
m
-3
alone (#2), the response-pattern seen in orthophosphate turnover-time (Fig.3) corre-
sponds to what would be expected in a system with nitrogen-limited osmotrophs
stimulated in their P-uptake by the added nitrate.
Conclusions
Our experiment supported the suggestion that neither organic-carbon limitation of
bacteria nor silicate limitation of diatoms constrained the functioning of the photic
zone microbial food web.As hypothesised, we also found a positive phytoplankton
response from adding phosphate alone. Seen in isolation, these results suggest a P-
limited system with a bioavailable N-reserve in the order of 800 µmol-N m
-3
.This
simple picture was however complicated by a response both in chl-a and in primary
production to adding NO
3
alone (#5), an additional effect of nitrate in all treatments
with NO
3
and PO
4
together (#6, #7 and #8), and a response pattern in orthophosphate
turnover-time resembling that expected under N-limitation. The possible role of N as
a co-limiting factor can thus not be ruled out. Interpretation was complicated by
changes in the control treatment (#1, no additions). Sampling, prefiltration, and con-
finement, alone or in combination, may thus have disturbed the state of the food web
present in the collected water.Two Lagrangian experiments are planned (May 2001,
May 2002) that will be unaffected by these problems.
References
1- Krom, M. D., N. Kress, S. Brenner and L. I. Gordon. 1991. Phosphorus limitation of
primary productivity in the eastern Mediterranean Sea. Limnol.Oceanogr.36: 424-432.
2 - Zohary,T. and R. D. Robarts. 1998. Experimental study of microbial P limitation in the
eastern Mediterranean. Limnol.Oceanogr.43: 387-395.
3 - Thingstad, T. F., U. L. Zweifel and F. Rassoulzadegan. 1998. P-limitation of both
phytoplankton and heterotrophic bacteria in the north west Mediterranean.
Limnol.Oceanogr.43: 88-94.
4 - Thingstad, T. and F. Rassoulzadegan. 1999. Conceptual models for the biogeochemical
role of the photic zone food web, with particular reference to the Mediterranean Sea.
Prog.Oceanogr.44: 271-286.
Acknowledgement:This work was financed by EU through project EVK3-CT-1999-00009
”CYCLOPS”, which is part of the "IMPACTS" cluster
Rapp. Comm. int. Mer Médit., 36,2001
213
Rapp. Comm. int. Mer Médit., 36,2001
Table 1. Nutrient additions to experimental carboys in µmol P, N or C m-3.
Additions made as single additions of orthophosphate, nitrate or glucose
Palone#1:P:0#2:P:10#3:P:50
#4:P:500
Excess N#5:P:0,N:1000#6:P:10,N:1200
#7:P:50,N:2000#8:P:500,N:1100
Glucose#9:P:0,N:0,C:10000
MIXED INDICATIONS OF MINERAL NUTRIENT LIMITATION IN A MICROCOSM EXPERIMENT
USING EASTERN MEDITERRANEAN SURFACEWATER.
T. Frede Thingstad
1
*, Nurit Kress
2
, Barak Herut
2
,Tamar Zohary
3
, Paraskevi Pitta
4
, Stella Psarra
4
,Thalia Polychronaki
4
,
Georgina Spyres
5
, Fauzi Mantoura
5
,TsuneoTanaka
6
, Fereidoun Rassoulzadegan
6
, Michael Krom
7
1
Dept. of Microbiology, University of Bergen, Norway - frede.thingstad@im.uib.no
2
IORL, National Institute of Oceanography, Haifa, Israel;
3
IOLR, Kinneret Limnological Lab (KLL), Tiberias, Israel.
4
Dept. of Oceanography, Institute of Marine Biology, Heraklion, Crete, Greece.
5
NERC-Plymouth Marine Laboratory, Plymouth, UK.;
6
Station Zoologique, Villefranche-sur-mer, France.
7
School of Earth Sciences, Leeds University, Leeds, U;K.
Abstract
Microbial food web responses to additions of phosphate, nitrate, and glucose were investigated in a microcosm experiment using eastern
Mediterranean surface water. Glucose alone gave no stimulation of bacteria, and there was free, bioavailable silicate. The food web thus
appeared not to be constrained by carbon limitation of bacteria or by silicate limitation of diatoms. Adding phosphate alone led to an
increase in both chlorophyll and primary production, suggesting the presence of a bioavailable N-reserve of
˜
800 µmol-N m
-3
.Turnover-
time for orthophosphate, however, increased when phosphate doses > 10 µmol-P m
-3
were added, and decreased when nitrate was added
alone, resembling the pattern expected for N-limitation. Mixed indications as to whether the osmotroph organisms were phosphate or
nitrogen-limited were thus found.
Keywords: Eastern Mediterranean, phosphorus, phytoplankton, bacteria
Fig.1.IdealisedmodelfortheP-?ow(adaptedfromThingstadand
Rassoulzadegan ,1999) proposing that, in the Mediterranean, the system
is particularly simple with all osmotrophs (heterotrophic bacteria, small
and large phytoplankton) are P-limited. If so, P-?ow should not be con-
strained by labile DOC (L-DOC) limiting bacterial growth rate, silicate (Si)
Fig. 2. (A) Chl-a on Day 5, and (B) mid-day primary production on Day 4
as functions of phosphate added (
?
)alone, or (
?
)in combination with
excess nitrate. Nitrate alone (#5) indicated by filled circle and value on
Day 0 by filled square. Error bars represent SE of mean of triplicate car-
Fig. 3. Response in turnover-time for orthophosphate in (A) control (#1)
and from adding phosphate alone (#2, #3 and #4), (B) nitrate alone (#5),
phosphate in combination with excess nitrate (#6, #7, and #8), or glu-
cose alone (#9). Error bars indicate SE of mean of triplicate carboys.