Rapp. Comm. int. Mer Médit., 36,2001
232
Introduction
With an acoustic methodology and technology it’s possible to examine
the trend of the pelagic density through the years and its spatial structure
relative to the period of the echo-survey. It may be of extreme importance
for fishery to know if biomass ?uctuations are periodical and related to its
spatial structure. The data of surface temperature can be used together with
the biomass’data to see if this physical factor can in?uence the fish distri-
bution.
Material and methods
The data on the biomass of small pelagic fish and its spatial distribution
were collected with acoustic methodologies and technologies. Biological
data (fish demography) were acquired from net samplings. Surface tem-
perature data (SST) were obtained from satellite [1]. All data were pro-
cessed using the GFRDBS (Geographical Fishery Resources Data Base
System) SW package designed by the IRPEM acoustic team [2]. GFRDBS
processes the data in a geographical context, converting Lat&Lon into
X&Y coordinates. The Elementary Sampling Distance Unit (ESDU) of the
X, Y map is one nautical mile.
The object of this study is the North Adriatic Sea, which extends from
Trieste to S. Benedetto del Tronto, from the Italian coast to the Mid-Line.
It has been investigated annually, in summer-autumn, since 1976 [3][4].
Results and discussion
One basic issue is the stability of the pelagic biomass and of its species
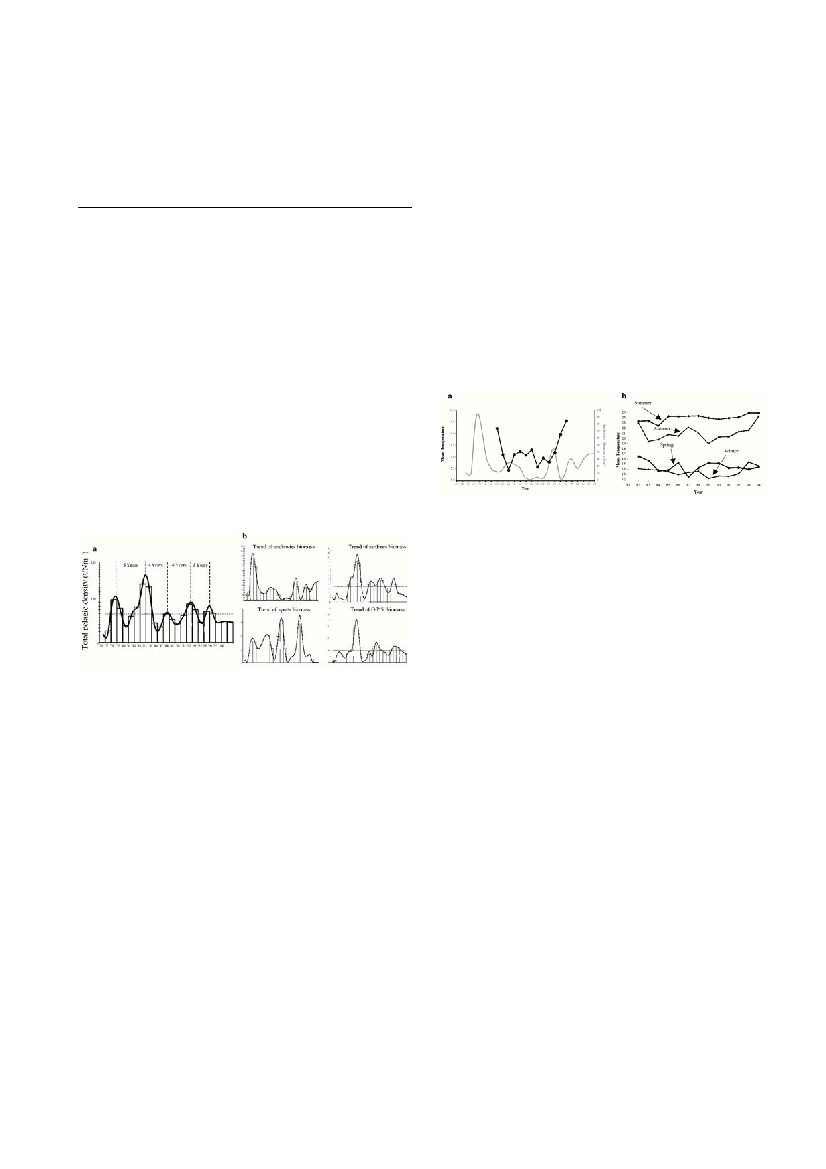
composition. Figure 1a shows the trend from 1976 to 1998 of the biomass
of pelagic populations as a whole.
Fig. 1.a.Fluctuation of pelagic biomass as a whole in the North Adriatic
Sea.b.Trend of pelagic populations in the North Adriaric Sea
Data indicate that the total pelagic biomass ?uctuated in a nearly peri-
odic way.The highest peaks (130 and 190 t/nm
2
, observed in 1978 and
1983, respectively) and the longest periods of ?uctuation (around 5 years)
occurred before 1985. After 1985 the peaks become smaller (85, 110 and
100 t/nm
2
) and, accordingly, the ?uctuation periods seem to shorten (1987;
1991; 1994). The mean ratio of the maximum level to the minimum one is
around 4. Mean biomass density from 1976 to 1998 in the North Adriatic
was estimated to be 78 t/nm
2
(i.e. 25%). In Figure 1b the total biomass was
divided into four groups: Anchovies, Sardines; Sprats and Other Pelagic
Populations (mainly Scomber scomber,Trachurus trachurus).
The biomass changes of single populations were not regular. In particu-
lar, the anchovy stock reached the maximum peak in 1978-79, it collapsed
in 1987-89 and ten years later (1996) began to recover.The ratio between
the maximum and minimum level was around 20. Mean density of the
anchovy stock was estimated as 23.5 t/Nm
2
. By contrast, the sardine stock
showed a minimum around 1978, and the highest peak in 1982-83 fol-
lowed by a period of stability (1985-1996). The ratio between the maxi-
mum and minimum level was very similar to that of Anchovy (25). Mean
density was calculated as 33.4 t/Nm
2
.The other species (sprats, mean den-
sity 12.6 t/Nm
2
; other pelagic species, mean density 9.8 t/Nm
2
) showed
very irregular changes. It could therefore be concluded that the pelagic
biomass as a whole ?uctuates almost regularly, whereas its composition is
affected by drastic and unpredictable changes. Moreover, there is evidence
of possible interactions between species such as anchovies-sardines and
sprats-anchovies.
A second basic question about pelagic resources is their spatial structure
and distribution, which for fisheries management may be more important
than the simple measurement of total biomass.
Generally, the basic spatial structure of pelagic populations is patchi-
ness, irrespective of the abundance of biomass. However, the surveys indi-
cate a contraction of the patches towards the coast in the period when the
anchovy stock collapsed (1986-90) and their expansion towards the open
sea when the stock recovered (from 1994). In the period 1992-1994, a
movement of the anchovy stock from the North to the South Adriatic was
observed. Unusual migrations of sprat from North to Middle Adriatic
(1987 and 1993) and as far as to the South Adriatic (1994) were also
detected. Figure 2a shows the trend of mean annual surface temperature
(SST) over the whole Adriatic Sea and Figure 2b the seasonal trend of the
same parameter in the period 1982-1996 [5].
Although there does not appear to be any direct, clear-cut relationship
between biomass and climate variations, one observation can be made. The
minimum values recorded in spring (1987), summer (1984), autumn and
winter (1989) temperatures as well as the fall of annual mean temperature
all coincided with the collapse of the anchovy stock (1986-1990). These
two phenomena might thus be related in some way.
Conclusion
The central result of this study, relevant also to management, is the tem-
poral and spatial changes of the pelagic biomass as a whole and per species.
The ?uctuations in time of the pelagic biomass as a whole seem fairly reg-
ular and pretty limited; in regard to the single species there is a range of
variation much larger and strongly irregular both in time and in space. T
h
e
?uctuation in space seem to be related, beside to alterations in migration
habit, to the biomass abundance. The ?uctuations in time have been dra-
matic for A
n
c
h
ovy (collapse of 1987), and very large for the other species
under examination. As an initial simplification the fall of A
n
c
h
ovy stock in
the period 1986-1990 have been attributed to the decrease of the surfa
c
e
temperature that could have affected the recruitment. How
ever the appro-
priate management of these resources requires greater knowledge of how
and to what extent the variations in space and time of the single populations
can be affected by internal factors (interactions between species), ex
t
e
r
n
a
l
conditions (climatic variations), predation and fisheries management.
Acknowledgements.
This research has been supported by Agriculture and Forest Ministry
(MIPA).We thank the Captain and the cruise of the R. V.Salvatore Lo
Biancofor their assistance during the cruises.
References.
1. Parmiggiani F., Rucabado J., Shneider P., 1997. Final Report of project
T-ECHO.In:T-ECHO AIR1 CT92 0314 - Annex: Environment. pp.1-26
2. Azzali M., 1997. Final Report of project T-ECHO.In:T-ECHO AIR1
CT92 0314 - Annex: Biological Acoustics, pp.1-14
3. Azzali M., Cosimi G., Luna M., 1990. Rapporto sulle risorse pelagiche
nei mari italiani stimate con metodi acustici. Rapp per MMM. page 12
4. Azzali M., Cosimi G., Luna M., 1993. Valutazione delle risorse
pelagiche, delle loro composizioni specifiche e distribuzioni spaziali
utilizzando una metodologia acustica integrata. Rapp. per MMM. page73
5. Azzali M., Cosimi G., Luna M., 1997, La biomassa, la struttura delle
aggregazioni e la distribuzione geografica delle popolazioni di acciughe e
sardine nel Basso Adriatico, stimate con la metodologia acustica. Rapp.
per MRAAF. 57 pp.
FLUCTUATIONS IN SPACE AND TIME OF PELAGIC POPULATIONS IN THE NORTH ADRIATIC SEA
FROM 1976 TO 1998
M. Azzali
1
, G. Cosimi
1
,A. De Felice
1
, M. Luna
1
and S. Manoukian
1
*
1
C.N.R. – I.R.Pe.M. - Largo Fiera della Pesca - 60125 Ancona - Italy
Abstract
The intent of this paper is to discuss some problems that have arisen from the spatial and temporal variability of small pelagic fish in the North
Adriatic Sea during the period 1976-1998. This variability can be attributed to variations in physical factors (in this paper surface temperature
is considered) acting on these resources in many compound ways, to fis
h
e
r
y, and to the internal complexity of the pelagic system.
Keywords: Acoustics, Adriatic Sea, Biomass, Pelagic, Temperature