Rapp. Comm. int. Mer Médit., 36,2001
250
Introduction
Information on species composition, distribution and abundance of eggs
and larvae of marine fishes has great importance for the study of the pop-
ulation structure of exploited stocks, for understanding the reproduction
rate of a population, and the fisheries exploitation of new areas.1,2,3 The
objectives of the present work are to study the abundance and distribution
of fish larvae in the Pagasitikos gulf in order to identify seasonal differ-
ences in larval compositions and by using the occurrence of fish larvae in
the plankton to determine to limits of the spawning period of adults.
Material and methods
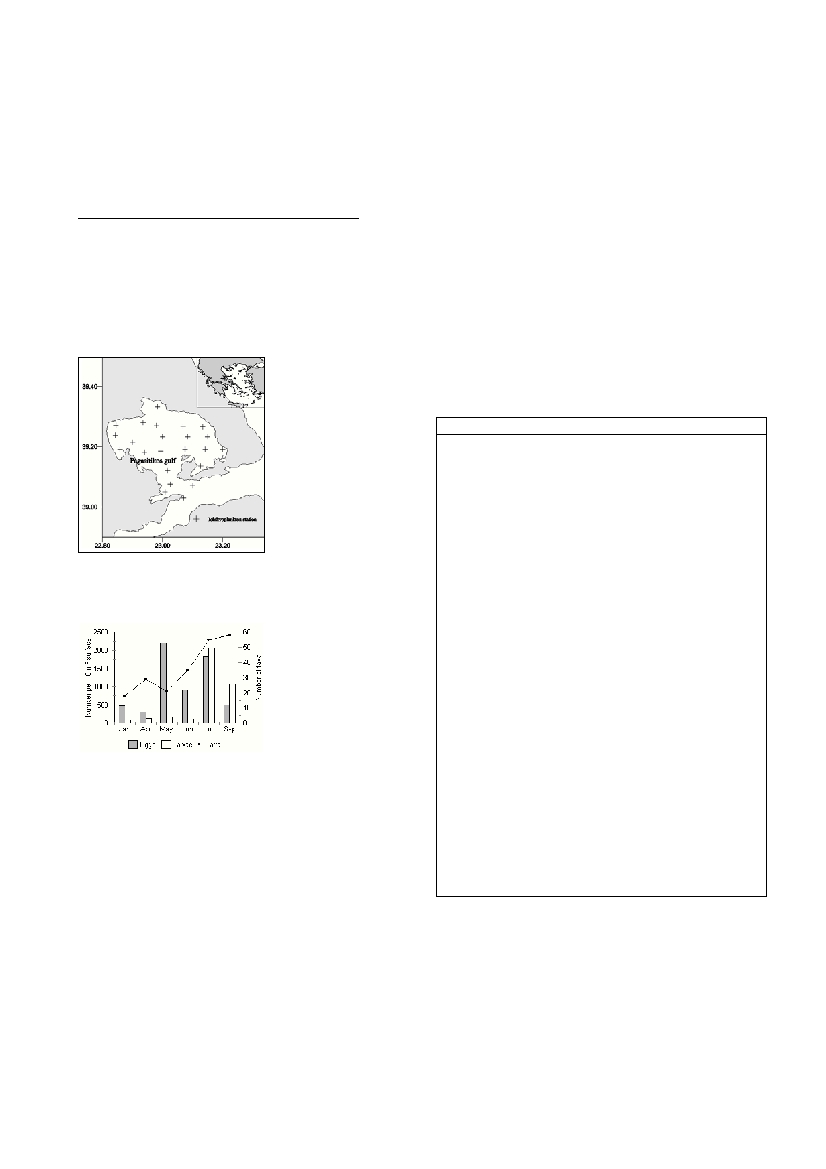
A grid of 23 stations was
designed in the study area (Fig
1), in which six ichthyoplank-
ton surveys took place at
J
a
n u
a r y, April, May, June,
July and September 1999.
With the exception of a few
stations that could not be re-
sampled mainly due to the bad
weather’s conditions, the same
stations were carried out
repeatedly in each of the six
i c h
t
hyoplankton survey
s .
Plankton hauls were made
using a Bongo net with mesh
sizes of 300 and 500 µm.
Hauls were taken obliquely at
a ship’s speed of 2.5 knots,
from just above the sea bot-
tom to the surface. Continuous recording of temperature and salinity have
been obtained using SEA CAT SBE 19 CTD.
Results and discussion
A total of 90 taxa of fish lar-
vae have been identified repre-
senting 38 families. A list of
the families of fish larvae for
each survey, including relative
a
bundance per cruise, is give
n
in Table 1. The maximum eg
g
a
bundance in the plankton wa
s
o
b
s
e
r
ved in May with 2196.69
egg per 10 m
2
and the mini-
mum in April with 304.2 eg
g
s
.
The maximum larval abu
n-
dance was observed in July
with 2071.49 larvae per 10 m
2
and the minimum in January
with 84.59 larvae. The maxi-
mum species richness value for the fish larvae was found in September with
58 taxa and the minimum in January with 18 taxa (Fig 2). The average sur-
face temperature (±SD) during the surveys were recorded at 12.21 °C * 0.54
in January, 13.81 °C ± 0.79 in April, 17.65 °C ± 0.96 in May, 18.22 °C ±
1.06 in June, 21.73 °C ± 2.43 in July and 22.22 °C ± 1.28 in September.
Larvae of the small pelagic families Engraulidae and Clupeidae and lar-
vae of the family Gobiidae dominated the ichthyoplankton making up the
~56,1% of the total catch. E. encrasicolus represented of the 32.65% of the
total number of larvae recorded. Other taxa caught at high percentages
were Gobiidae 1. (8.98%), S. hepatus(7.63%),S. aurita(7.61%),T.
mediterraneus(6.59%),C. macrophalma(5.78%) and C. chromis(5,29%).
Taking into consideration the description of the ichthyoplankton assem-
blages during the six surveys, it is clear that the number of taxa and the egg
and larval abundance exhibited ?uctuation during the study period. Small
and medium-size pelagic fishes like E. encrasicolus, S. aurita, S.
pilchardusandT. mediterraneus, dominated the ichthyoplankton samples
throughout the year.This indicates that the Pagasitikos gulf is an important
spawning ground for small and medium pelagic fishes. Larvae of shore
fishes (Gobiidae, Serranidae, Cepolidae, Blenniidae, Labridae,
Pomacentridae e.t.c.) recorded at relatively high abundances, could be pos-
sible correlated with the wide continental zone of the study area.
Taking into account the temporal distribution of the larvae of the most
abundant species/genus collected during the six surveys in the study area,
it appears that the majority presents an extended occurrence in the plank-
ton, lasting more than four months. The high values of the larval abun-
dances and number of taxa recorded during the period between the end of
summer and the beginning of autumn could be possibly correlated with the
high water temperatures as well as the autumn peaks of phyto- and zoo-
plankton in this area.
Table 1.Average abundances (number per 10 m
2
surface water) of iden-
tified larval families,collected during the six cruises in the Pagasitikos
gulf.
References
1. Ahlstrom E.H. and Moser H.G., 1976. Eggs and larvae of fishes and their
role in systematic investigations and in fisheries. Revue des Travaux de
l'Institut des Peches Maritimes, 40: 379-398.
2. Saville A., 1964. Estimation of the abundance of a fish stock from egg and
larval surveys.Rapp. P.-v. Reun. Cons. int. Explor. Mer., 155: 164-173.
3. Smith P.E. and Richardson S.L., 1977. Standard techniques for pelagic fish
SEASONAL STRUCTURE OF FISH LARVAE ASSEMBLAGES IN THE PAGASITIKOS GULF (GREECE)
Caragitsou E., Siapatis A.* and Anastasopoulou A.
National Centre for Marine Research, Aghios Kosmas, Athens, Greece - e-mail : electra@ncmr.gr
Abstract
Temporal abundance and species composition of fish larvae assemblages in the Pagasitikos gulf for the period January 1999-September
1999 are described. Seasonal differences in species composition and abundance in the study area appear to be associated with differences
in the environmental conditions, particularly with temperature. Larvae of small pelagic fishes such as Engraulidae and Clupeidae, as well
as larvae of shore-fishes, such as Gobiidae dominated the ichthyoplankton. Both larval diversity and abundance were higher by an order
of magnitude in July and September 1999, corresponding to warmer waters.
Keywords: Ichthyoplankton, fishes, larvae, reproduction
Family
JanAprMayJunJulSep
Apogonidae
2.33.5
Belonidae
0.1
0.2
Blenniidae
0.23.26.49.21.00.9
Bothidae
5.68.50.11.641.249.0
Callionymidae4.43.71.27.127.49.5
Caproidae
0.5
Carangidae
0.3
1.1199.144.4
Carapidae
0.1
0.8
Centrolophidae
0.5
Cepolidae
2.076.4135.9
Citharidae
20.8
Clupeidae
41.813.90.33.2276.82.0
Cynoglossidae
23.0
Engraulidae
1.161.122.9839.1286.3
Gadidae
37.70.6
Gobiesocidae0.2
Gobiidae
41.991.039.823.785.7252.1
Labridae
0.01.57.42.412.37.3
Lophiidae
0.3
0.2
Merlucciidae0.20.3
0.1
Mugilidae
0.30.3
2.36.6
Mullidae
0.3
0.4
Myctophidae0.91.60.50.17.11.3
Ophichithidae
0.81.0
Ophidiidae
1.46.6
Pomacentridae
1.7130.363.9
Scombridae
1.282.06.7
Scopththalmidae
0.70.1
Scorpaenidae
4.74.8
Serranidae
3.112.0183.487.5
Soleidae
0.7
1.10.5
Sparidae
0.310.537.218.99.220.9
Sternoptychidae
0.1
Syngnathidae
1.0
Trachinidae
1.74.1
Trichiuridae1.0
0.8
Triglidae
0.625.410.1
Uranoscopidae
0.3
Unknown-Destroyed0.81.717.39.357.718.1
Figure 1. Map of the study area
Figure 2. Average abundances (number
per 10 m
2
surface water) of the total eggs
and larvae and number of larval taxa,
collected during the six cruises in the