Rapp. Comm. int. Mer Médit., 36,2001
339
Indicator “Number of Species”
As tested in Greek waters the number of species in a benthic assem-
blage decreases with depth and varies with the sediment type increas-
ing in mixed sediments comparing to muds. Also one of the central
patterns in biodiversity, noted universally, is that the number of species
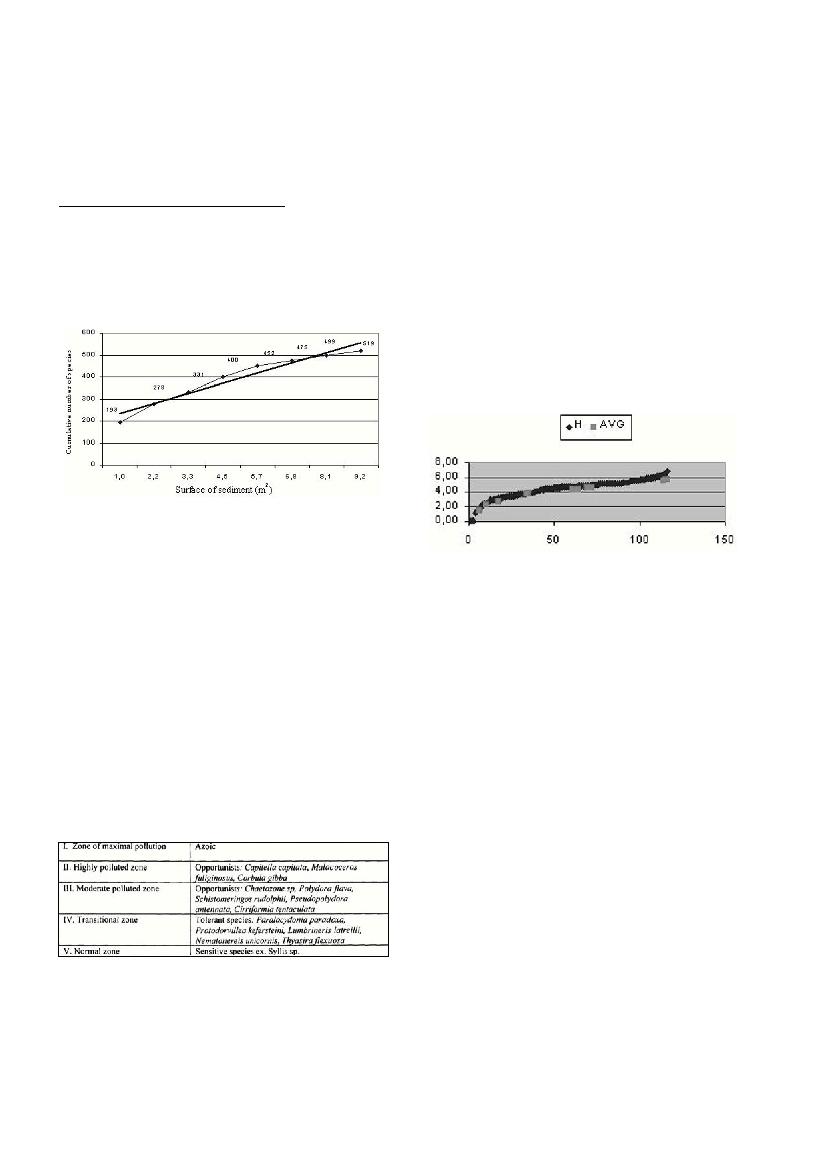
increases with the area sampled. Figure 1, based on aggregated data
collected from 9 stations, over 3 years, in Geras Gulf (2) shows such
a trend.
Figure 1 : Increase in number of species with sampling effort
Based on data collected over a variety of soft bottom habitats in
Greek waters it appears that number of species, in undisturbed area
ranges between 22 and 165 species per 0.1m
2
, depending on depth and
type of substratum. The number of species (S) can be a reliable mea-
sure of environmental stress provided that it is used when comparing
benthic communities :
a) occurring within a well defined sampling unit(standard 0.1m
2
)
b) from samples collected with the same gear(standard grab 0.1m
2
,
mesh sieve 0.5mm)
c) at the same depth range and sediment type(ranges to be defined
per Sea).
d) The species identification is being done at the same taxonomic
level (4 major groups or all groups).
Indicator “Abundance (N)”
The abundance of benthic organisms in a given area is too variable
and cannot be used as a reliable measure of environmental stress. On
the other hand, trends in abundance of “key species”, if well defined,
would be a good indicator.
Indicator “Key species”
Based on a synthesis of reviews on the subject and on the data of
Saronikos Gulf (1,3,4) the following table shows the zones of pollu-
tion with the respective key species.
Table 1. Key species, indicative of the degree of environmental distur-
bance
The key species characterising a pollution gradient may be different
when different geographical areas are examined.
Indicator “Community diversity (H)”
The Shannon-Wiener Index (5) of community diversity in Greek
waters has been calculated to range between 1,12 to 6,81, if calculat-
ed on pooled data. However, if calculated on a standard sampling unit
(0.1m
2
) the maximal value is 5,76 bits/unit. Figure 2 shows the varia-
tion of H in 116 sites all over Greece. Certainly community diversity
is lowered by severe pollution stress compared with control areas or
years.Values lower than 1,50 bits per unit have been calculated at the
badly polluted areas of Saronikos Gulf (zone I), between 1,5 and 3 for
highly polluted areas of Thermaikos and Saronikos (zone II), 3-4 for
moderately polluted (zone III) areas, 4-4,6 for transitional zones (zone
IV) and over 4,6 for normal zones. The maximum values of H coin-
cide with the pristine areas of Sporades marine park, Kyklades
plateau, Rhodes isl., Ionian Sea and Petalioi Gulf Aegean) : 6,81 bits
per unit.
Figure 2 : Distribution of community diversity (H) over 116 Greek sites.
AVG : H/0.1m
2
The range of the Shannon Diversity index should be used as a tool
of pollution evaluation, taking into account not only the substrate and
depth of the given area but also the regional standards of the case area.
Also when evaluating H, one should take into account separately its
two components together with the faunistic data, in order to detect
extreme abundance of opportunists indicating disturbance. In Greek
Waters based on the community diversity index alone, 5 classes of
community health can be arbitrarily defined :
Class I : H<1,5 : Azoic to very highly polluted
Class II : 1,5 <H<3 : highly polluted
Class III : 3<H<4 : moderately polluted
Class IV : 4<H<4,6 : for transitional zones
Class V : H>4,6 : normal
All the above described benthic indicators were used to efficiently
describe the state of the marine ecosystem in Saronikos Gulf, receiv-
ing the domestic and industrial effluent of Athens. Based on data col-
lected between 1974 and 1999, though sparse in time, all of the above
classes of community diversity were recognised at least over time.
References
1- Bellan G., 1985. Effects of pollution and man-made modifications on
marine benthic communities in the Mediterranean : a rev
i
ew. In : M.
Moraitou-Apostolopoulou and V. Kiortsis (eds.), Mediterranean Marine
Ecosystems, NATO Conf. Ser. 1, Ecology, Plenum Press, N.Y., 8 :163-194.
2- Bogdanos C., Simboura N. and Zenetos, A., (in press). The benthic
fauna of Geras Gulf (Lesvos isl., Greece) : Inventory, distribution and
some zoogeographical considerations. Zoological Archive ( Accepted).
3- Dauvin J.-C., 1993. Le benthos : temoin des variations de
l’environment.Oceanis, 19(6) : 25-53.
4- Pearson T.H. and Rosenberg R., 1978. Macrobenthic succession in
relation to organic enrichment and pollution of the marine environment.
Oceanogr. I, 16 : 229-311.
5- Shannon C.E. and WeaverW., 1963. The mathematical theory of
communication. Urbana Univ. Press, Illinois, 117 pp.
SOFT BOTTOM BENTHIC INDICATORS
A. Zenetos and N. Simboura*
National Centre for Marine Research, Hellinikon, Athens, Greece - zenetos@?.ncmr.gr, msim@?.ncmr.gr
Abstract
Based on real values and/or ranges of values, the benthic parameters of the number of species (S), the abundance (N), the Shannon-Wiener
community diversity (H), the “key species” and the trends of these parameters, were tested as possible indicators to assess the state of the
ecosystem. Ranges of the benthic indicators in Greek waters and the conditions under which each parameter should be evaluated are given.
A classification scheme of marine ecosystem health is proposed.
Keywords : benthic, indicators, Greek waters