We all seem to have survived the rough waters of yesterday, which did
make everyone’s work a bit more challenging. The captain had asked everybody to make sure that all the equipment was tied down properly, so we thought we were in for a bad night, but today we are back to sunny and dead calm! Last night we had some marvelous entertainment as a group of about 20 dolphins decided to follow our ship. Six or so were right under the hull, while the others were about 40 meters ahead. At one point five of them leaped out of the sea at the same time, amazing all who were watching.
| During our night sampling Lionel Guidi launched his zooplankton nets at the 200m level, and while we were waiting for the net to come back up we got a "squid show", some measuring about 20 cm, dashing around in our spotlight, obviously looking for dinner. I had never seen one alive until then, and they are really fast. When the nets came up, Lionel touched a screen area on the collection tube and certain fluorescent plankton started to light up like fire flies. Also caught were several jellyfish of a good size (about 7-10 cm), and a number of krill and shrimps as well. |
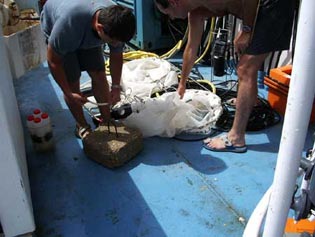
Lionel Guidi Set up Zooplankton Nets |
This morning I spoke to Giuseppe Siena, Physical Oceanographer, CoNISMa-ULR Parthenope, Naples. about some of the monitoring systems on board.
Q. Can you explain how you monitor the CTD casts ?
GS: When we begin the downcast we use a dedicated software which consists of many windows that represents a plot of the vertical profiles of the measured parameters and the numerical values in real time, during the downcast. These data are visualized by using different colors; the main ones for physical oceanography are temperature, salinity and density, with oxygen and fluorescence giving additional information. As we look at the various indicators we can decide at which depth level the interested scientists want to close or fire the bottles to take water samples. We use standard levels and we choose some varying levels that are related, for example, to the maximum concentration of oxygen or maximum concentration of chlorophyll (DCM), based on the visual readings that we see on our computer screen during the downcast. Then when we arrive at the sea bottom, and start the up cast we close the bottles at the chosen levels. Eventually the CTD is brought on board and this is the first part of the sequence.
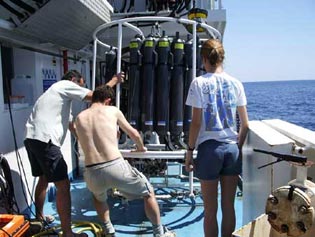
Giorigo Budillon, Rosario Lavezza, Sophie Abercron |
Then we process the collected data with another kind of software which is called SBE Data Processing, from Sea Bird Electronic Inc., which has a lot of different routines that we can use to filter, average, and clean the data or find values. Eventually we get an ASCII file, which is a conventional format that is used around the world. Then we can extract out particular information such as depth, pressure, so now we have a very good visual picture of the depth distribution of the data during the cast. One program that I use on board, because analyzes the data very fast is the Ocean Data View program, which is a free program found on the internet. So we can visualize the data in real time, in different ways, like vertical and horizontal sections, vertical profiles and TS diagrams of part or the entire data sets. |
With this isolation we can observe water column structure and characterize in physical way the areas under study.
Then we can recognize as in our case for the first transect that maybe there is a particular dynamical situation in which we have a cyclonic gyre with an anti- cyclonic one underneath. So it looked like we had a very particular situation which we will be able to confirm only when we make a cross control with other data sets. This is the principal way in which we operate: we have a variety of collection data and ways that we can visualize the data.
Q. Have you found anything else that is interesting so far?
GS: As a physical oceanographer the general situation is close to what we expected, but we now have more data, which gives us a clearer resolution (picture) and thus a better scale than in previous studies conducted in this area. The only "strange" thing is that we have found the center of a cyclonic circulation, that perhaps has already been reported in previous papers, but certainly not seen as clearly as in our new data.
Well that is all for now, I am Siri Campbell reporting from the CIESM SUB1 cruise.
|